Probabilitistic Decision Making

Micro-specialisation and prognosis overestimation

I am a general dental practitioner, a jack-of-all trades in the dental world and possibly becoming an endangered species. To keep updated I travel to a lot of international conferences that cover the dental disciplines such as implants, restorative dentistry, prosthetics, endodontics, and periodontics to name a few. To my mind dentistry is a speciality within general healthcare so the disciplines above should be considered as sub-specialities or micro-specialities of dentistry and over recent years there has been a shift away from the generalist to the specialist (1). What I observed was that each discipline is just a bit better than the other at saving or restoring teeth so at an implant based conference implants outperform root-fillings and vice-versa.  Now if one carefully adds up the success rates across the disciplines of all the treatment options it becomes greater than 100%, which it impossible. What is happening is, due to uncertainty the  clinicians have to use probabilistic data and by restricting the number of treatment options create  overestimates for the relative success or suitability of that treatment. This is a problem of ‘subadditivity’ and the ‘unpacking principle’:

Subadditivity – This is where the sum of two probabilities is greater than 1.0.

Unpacking – As more detail of a hypothesis is provided (unpacked) there is an increase in its estimated probability.

An EBSCO literature search using the search terms “unpacking principle or subaddition” and “medical decision making” produced  three relevant papers with no systematic reviews or meta-analysis(2–4).To summarise the results; in Cahan et al’s paper 65% of the doctors exhibited subadditivity with a mean probability of 137% and Redelmeier et al concluded that clinicians need to unpack a broad category of treatment opptions rather than compare a single treatment against unspecified options.

To help understand these concepts I have worked an example for you below:

“A patient attends a dental surgeon complaining of difficulty chewing due to a loss of lower back teeth. On one side are two premolars and on the other one premolar. Both last standing teeth need new crowns. The upper arch is intact.”

The option are as follows:

  1. No treatment ( I will ignore this options in this example.)
  2. Two milled crowns and a metal/acrylic denture.
  3. Two crowns and a single implant following the shortened arch concept(5).
  4. Two crowns and four single implants. (Maximised model)
  5. Two tooth-implant retained three unit bridges (F-I).

The 10-year survival estimates for the individual components of the above treatment are:

  1. Single metal-ceramic crown 94% (6).
  2. Single tooth implant 89% (7)
  3. Tooth-implant bridge 77% (7)
  4. Metal acrylic denture 50% (8)

Looking at the individual survival figures the best treatment options involve metal-ceramic crowns on vital teeth or single crown implants, the next option is the tooth-implant bridge and finally the denture. The intuitive choice of most people would be Option 4.  (Two crowns and four single implants) due to the high survival rates. Once one becomes aware of the effects of subaddition and unpacking however Option 4. is not such a strong option as it at first appears in terms of complications and maintenance costs (Table 1.)


Unit treatment option 10-year Survival P Complete Treatment options Options Complication free
Implant Single crown (SCI) 89 0.89 2 crowns ,1 implant 2 x SC,1x SCI 0.79
Single crown (SC) 94 0.94 2 crowns, I denture 2 x SC, Co/Cr 0.44
Cobalt chrome denture (Co/Cr P) 50 0.5 2 crowns,4 implants 2 x SC, 4 x SCI 0.55
Fixed-implant bridge (F-I) 70 0.7 2 Fixed-Implant bridges 2 x F-I 0.49

Table 1.


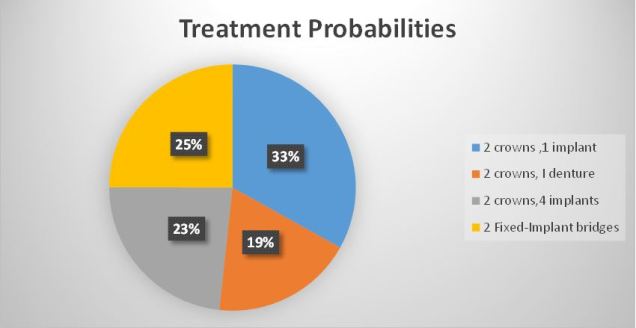
The avoid the cognitive error of subaddition the clinician/patient can only choose one option to follow, this is best represented as a pie-chart (Fig 1.).
TP1

Fig 1.

The conclusion when the treatment options are unpacked and compared is that the two bridges or the two crowns/four implants have about the same complication rate. The two crowns and the implant is the safest and the denture option has the highest failure rate.

There is however one more consideration and that is relative cost/benefit which is generally overlooked in the research literature. Fortunately, with the data above it is quite simple to calculate this using the concept of ‘expected value’ For this example I have used the total estimated cost of the treatment and multiplied it by the probability of a complication. To calculate the probability of any complication I used the formula (Table 2):

p(complication)=1-p(complication-free).

Treatment options Options Complication free Complications (P) Estimated Treatment Cost Estimated Value
2 crowns ,1 implant 2 x SC,1x SCI 0.79 0.21 3700 790
2 crowns, I denture 2 x SC, Co/Cr 0.44 0.56 2200 1228
2 crowns,4 implants 2 x SC, 4 x SCI 0.55 0.45 11200 4991
2 Fixed-Implant bridges 2 x F-I 0.59 0.41 6000 2443

Table 2.

TP2

Fig 2.

Hopefully it’s clear that initially the two crown, four implant option may be more appealing it does carry a significantly greater cost compared to the bridges. The safest treatment both in terms of cost and predictability is the shortened arch principle due to its simplicity.

The ‘take-home message’ is that as the number of treatment items increase for an individual, the risk of complications and cost can also increase. By taking a little time to ‘unpack’ the alternate treatment options it can help reduce overconfidence and clarify choice as part of the consent process.

References:

  1. Levin-Scherz J. What Drives High Health Care Costs. Harv Bus Rev [Internet]. 2010;88(4):72–3. Available from: http://www.ncbi.nlm.nih.gov/pubmed/20402058
  2. Redelmeier DA. Medical Decision Making in Situations That Offer Multiple Alternatives. JAMA J Am Med Assoc [Internet]. American Medical Association; 1995 Jan 25 [cited 2014 Mar 11];273(4):302. Available from: http://jama.jamanetwork.com/article.aspx?articleid=386588
  3. Liberman V, Tversky A, Redelmeier DA. The Psychology of Decision Making Probability Judgment in Medicine : 1995;
  4. Cahan A, Gilon D, Manor O, Paltiel O. Probabilistic reasoning and clinical decision-making: Do doctors overestimate diagnostic probabilities? QJM – Mon J Assoc Physicians. 2003;96(10):763–9.
  5. Käyser a F. Shortened dental arches and oral function. J Oral Rehabil. 1981;8(5):457–62.
  6. Reitemeier B, Hansel K, Kastner C, Weber A, Walter MH. A prospective 10-year study of metal ceramic single crowns and fixed dental prosthesis retainers in private practice set tings. J Prosthet Dent [Internet]. The Editorial Council of the Journal of Prosthetic Dentistry; 2013;109(3):149–55. Available from: http://dx.doi.org/10.1016/S0022-3913(13)60034-7
  7. PJETURSSON BE, LANG NP. Prosthetic treatment planning on the basis of scientific evidence. J Oral Rehabil [Internet]. 2008;35(s1):72–9. Available from: http://doi.wiley.com/10.1111/j.1365-2842.2007.01824.x
  8. Vermeulen a H, Keltjens HM, van’t Hof M a, Kayser  a F. Ten-year evaluation of removable partial dentures: survival rates based on retreatment, not wearing and replacement. J Prosthet Dent [Internet]. 1996 Sep;76(3):267–72. Available from: http://www.ncbi.nlm.nih.gov/pubmed/8887799

 

Preparation for Swiss Irontrail T121

The Heart of Snowdonia

IMG_0160


I took the opportunity of good weather and light winds to get a decent training session ready for the upcoming Swiss Irontrail in August. To get some strength into my legs I decided to use a route based on the Paddy Buckley Round(PBR) and the Heart of Snowdonia  Challenge Walk (HSCW) in North Wales.

The T121 is a 128.1km route with 6990m +/- starting and finishing in Davos, Switzerland (http://www.irontrail.ch/en/trails/t121/). My training goal for ultra-distance events is to comfortably complete 40%, this improves strength and stamina without creating too much tissue damage and has worked for both Ironman Triathlon and the Marathon des Sables.

I started out at 10:30 on a warm but overcast morning outside the café in Capel Curig heading south past the Pla y Brennin Outward Bound Centre. Leaving the shrieks and squeals of kids learning to kayak behind, I ascended the path to Moel Siabod heading South. Once on top the weather cleared up and the sun came out giving some great views of the National Park. I avoided the descent down the back of Moel Siabod as per the HSCW since my map did not cover the area and followed the PBR along the ridge line to Cnicht. The route roughly follows an boundary fence and is very boggy. Once at Cnicht I reverted to the HSCW, the descent is quite steep and the rocky which is not helped by the rock strata being inconveniently angled. A note for the future would be to continue south about a kilometer and pick up the foot path to the lake. Once off the steep slope the descent to Geli Lago is quite beautiful and at this time of year the valley is an incredibly lush green. There are signs out informing the walker that they are building a micro-hydro to generate electricity of the local population which sounds quite innovative until you walk past the ruined farm and water-wheel.

IMG_0156
Sundew (Drosera Rotundifolia)


Crossing the road to Beddgelert the route ascends the Watkins path along the Afon Cwm Llan and veers left at the mine workings to take the ridge to Crib Tregalan. Evening was closing in now and though there were good views all around Snowdon summit was shrouded in cloud. I arrived at the summit just before sunset and got a couple of nice images as the clouds cleared. There were a few people getting ready to sleep on the summit so I had a terrible freeze dried meal and continued my walk to test out a new head torch.

IMG_0161
Snowdon Summit at Sunset

I quite like walking at night, it changes all the normal references but I decided to stop and bivi until dawn on top of Moel Cynghorion.There was a little light drizzle during the night but dawn was clear again as I descended the track to LLanberis past quite a few abandoned sheep farms and mine tailings.

IMG_0171


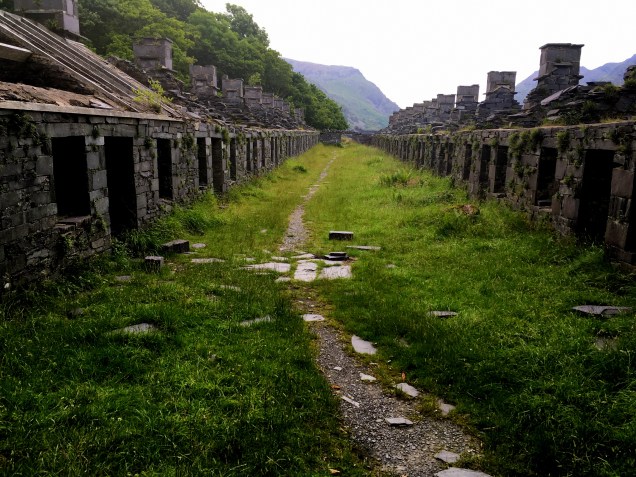
The view is dominated by the huge slate Dinorwic mine (1787-1969) above Llanberis going almost to the top of Elidir Fach.

IMG_0172

Llanberis is now quite a sleepy little town with lots of small camp sites and B+B’s but looking at the size of the old churches and Chapels reminds one that at its peak 3000 men worked in the quarry. The route leads up through the abandoned slate mine and is quite a sobering place when you think about the human labour involved getting the slate out of the mountain-side. Eventually the track changes from mine to open hill side disappears.  Ascending Elidir Fach and Fawr is quite hard as there is no obvious path on the Llanberis side until one has crossed the dragons back of loose boulders and can see Y Garn.

The last section is quite straight forward heading to the summit of Y Garn and then taking the west ridge down to Llyn Ogwen. The modern world returns as the small lake was teaming with visitors and school parties.

Total distance covered was 55km in 16 hrs.40min and total ascent 3881m. Perfect.


Antibiotic Prophylaxis Guidelines ????

A Re-analysis of Dayer et al (2014)

 Abstract

Over the past twelve months there has been a substantial amount of correspondence toing and froing in the medical/dental journals with regard to the National Institute of Clinical Excellence (NICE) Guidelines on antibiotic prophylaxis for infective endocarditis (IE). In 2008 NICE recommended complete cessation of antibiotic prophylaxis for infective endocarditis. Last year saw the publication in the Lancet of an analysis of infective endocarditis incidence 2000-2013 which precipitated a review by NICE of their position. Following their review the conclusion was that the new evidence may be at a high risk of bias and held the position of complete cessation even for high risk individuals.

In this paper I have taken the data produced by Dayer et al and reprinted in Clinical Guidance 64 (PIE) Appendix O. Professor Ramsey concluded the abstracted data was robust enough for analysis so I have also take the liberty of analysing it.

The statistical analysis applied to this data by Ramsey appeared too complex for the normal general dental practitioner to comment on its validity. To this effect I have applied a simpler and more intuitive transformation commonly used in quality control called a Shewart Control Chart. From this analysis there are three observations:

  • The data should not be analysed as a combined figure as the low risk population drowns the signal from the high risk.
  • The introduction of the NICE policy of cessation of antibiotic prophylaxis has not altered the incidence of IE on low risk individuals.
  • There is a strong signal change in the incidence numbers mid 2008 for the high risk individuals.

My independent analysis using unconventional (to the medical establishment) analytical tools concludes even allowing for an increase in IE prior to 2008 there is still a significant increase in cases in the high risk population starting in early 2008. Therefore unless there is strong evidence to the contrary NICE guidelines need to come into line with the European Society of Cardiology guidelines with immediate effect. This means giving antibiotic prophylaxis only to high risk individuals undergoing high risk procedures. Where perfect data cannot be provided then it is our duty to make best use of the data at hand and apply the principle of Occam’s razor – “Among competing hypotheses, the one with the fewest assumptions should be selected”.

Introduction

Over the past twelve months there has been a substantial amount of correspondence toing and froing in the British medical/dental journals with regard to the National Institute of Clinical Excellence (NICE) Guidelines on antibiotic prophylaxis for infective endocarditis (IE)(1,2). In 2008 NICE recommended complete cessation of antibiotic prophylaxis for infective endocarditis. This point of view is supported by both the British Dental Association(3) and the Faculty of General dental Practitioners(4). Last year saw the publication in the Lancet of an analysis of infective endocarditis incidence 2000-2013 in England(5) which precipitated a review by NICE of their position. Following their review the conclusion was that the new evidence may be at a high risk of bias and held the position of complete cessation even for high risk individuals(6).

Practitioners rely heavily on these guidelines to help formulate the best and safest treatment plans for their patients. Until the publication of the post guideline review in the Lancet there was not point of reference to assess the changes the guidelines had made. After reading the article and the subsequent comments in the NICE review there were some questions that still was not adequately answered, such as the increase in endocarditis if removing prophylaxis was not a factor? If the data was correct then what about the analysis and interpretation. The critic in the NICE review does not clarify the question as to why there is a data shift or when it occurs.

In this paper the data produced by Dayer et al was reprinted in Clinical Guidance 64 (PIE) Appendix O. Professor Ramsey concluded the abstracted data was robust enough for analysis, so this is the data set used in the analysis below.

Methods

The NICE review document provided me with the abstracted data from Dayer et al in Appendix 1. Page 476. The data from Appendix 1. Was entered into a standard Excel spreadsheet for analysis.

The data has been divided into three tables:

  • High and Low Risk combined
  • High Risk
  • Low Risk

I cannot make any comment of the technicalities of change point analysis, segmented regression or Hinkley algorithms since I have no training in these areas.

To analyse the data I have plotted using a Shewart Individuals Control Chart(7).

The centre line is the median of the individual values to reduce the effect of outliers.

The Upper Natural Process Limit (UNPLx) based on median values of the moving range is utilised to eliminate the natural variability in the incidence values. The UNPLx is the 3 sigma limit of the time sequence. The advantages are:

  • The three-sigma limits will filter out virtually all of the routine variation regardless of the shape of the histogram.
  • Any data point that falls outside the three-sigma limit is a potential signal of a change
  • Symmetric, three-sigma limits work with skewed data.

This data analysis is extremely simple but powerful in its transparency and ease of reproduction without complex statistical tools.

To interpret the chart there are two stopping rules.

  • Two consecutive values above the UNPLx signify a signal (3 standard deviations from median).
  • Eight or more successive values on the same side of the median centre line means the time series has shifted from its historic reference, the chances of this happening are over 128:1 (p=0.996)

The initial charts are using the base line date up to the implementation of the new NICE guidelines to set median and UNPLx values. The median and UNPLx values are based on the values 1-99 (Paragraph 2.1)

If the chart fulfils either of the two rules above then the incidence rate is significantly altering and the median/UNPLx values are recalculated using the eight values that are out of specification.

Results

Combined Incidence Data

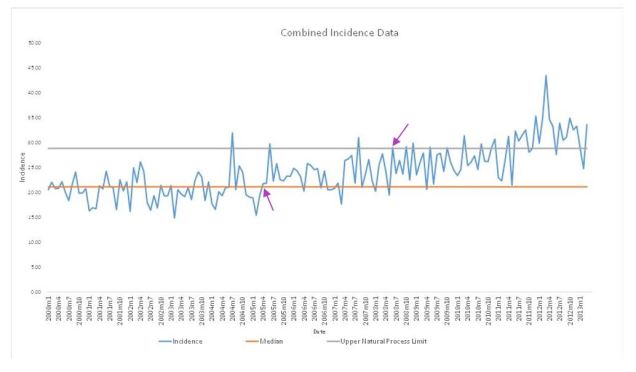
1

There is a signal change at 2005m4 (data point 65) and another at 2008m6 (data point 103). If I correct the median and UNPLx starting at point 65 then the second signal change still remains at June 2008 and continues to drift further away from the median from there until its two consecutive data points beyond 3 sigma at 2012m2.


2

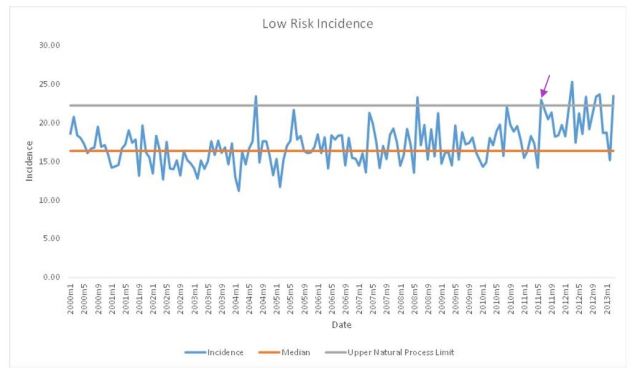
Low Risk Incidence

The low risk chart shows no signal change until 2011m6.

3

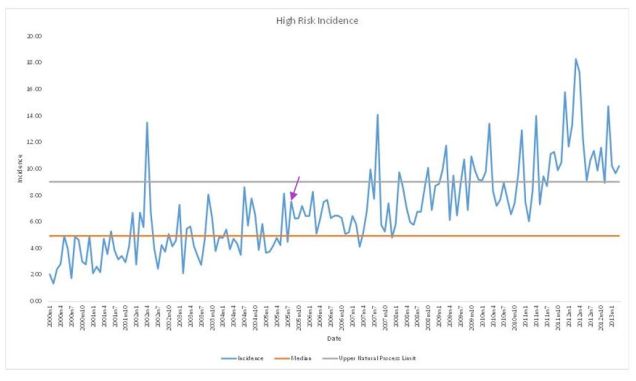
High Risk Incidence

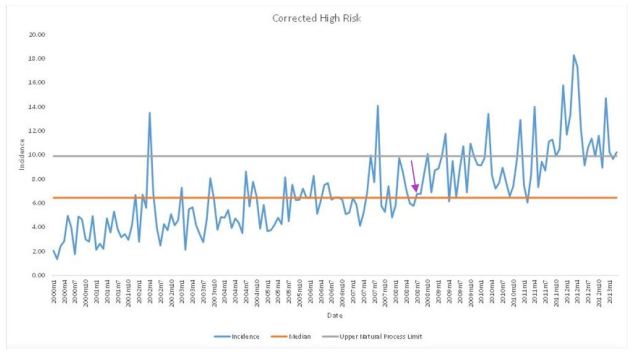
The first signal change is at 2005m8 so the median/UNPLx was corrected upwards and the first major signal change appears on the 2008m7 and continues in an upward trend. At 2011m8 there are two consecutive data points above the 3 sigma level (UNPLx).

45

Corrected data using 2008 to 2011

If one segments the data sequence it is possible to give the illusion of hiding the signal. This is achieved by selecting the data from the guidelines change (2008m2 to 2011m4 when the time line start to shift 3 sigma from median) and recalculating the median and UNPLx. Two things to note however, the chart distinctly shows a reduced incidence before the guideline change and the single point above the UNPLx may be an outlier and need specific investigation. I placed in the lower natural process limit to show that the more variability one includes in the data the more the noise increase so only the most extreme data exceeds the control limit.

6


Interpretation

The NICE critique by Ramsey focused predominantly on the interpretation of the combined values chart using fairly complex modelling beyond my understanding. The answer to the question however cannot be found in the combined chart as to whether we should give antibiotic prophylaxis to high risk individuals having high risk procedures. The graph is moderately confounded by combining the low risk/high risk data within the population studied. There was a change in signal in 2005 which needs explaining but this may be due to a gradual increase in the number of high risk individuals as the population ages. Having said that, the signal alters again in June 2008, six months after the guideline implementation and continues to move out of statistical control.

Additionally by adding multiple change points in paragraph 3.2 (visualised in Figure 3) the analysis is removing the past history as it proceeds thus giving the illusion of a reduced change. This in effect hides the signal change.

The low risk chart shows no change until mid-2011 confirming that there is no data to support antibiotic prophylaxis for low risk individuals. The larger number of low risk individuals to high risk individuals dilutes the signal change in the combined graph.

The high risk chart mirrors the combined chart in showing a signal change in 2005 and when corrected still shows a change in mid-2008.

Conclusion

The Ramsey review appears to focus purely on a critique of the data analysis of the combined incidence rather than answering the question of whether the data supports continued withdrawal of antibiotic prophylaxis for high risk individuals having high risk treatments. The gradual rise in infective endocarditis incidence may be a function of a general increase of vulnerable individuals and needs further investigation so a correction factor can be applied. The data must be looked at separately and not in the combined incidence data set as the larger group of low risk cases drowns out the signal from the high risk. This may explain the increase at 2005. There is a definite signal change in the high risk individuals in 2008. The contrast between the low and high risk individuals supports the argument for reinstating AP in line with the European guidelines. Further data needs to be collected to analyse the change point in 2011, however the rule of small numbers may apply to the outliers.

References

  1. Chambers JB, Thornhill M, Shanson D, Prendergast B. Antibiotic prophylaxis of endocarditis: a NICE mess. Lancet Infect Dis [Internet]. Elsevier Ltd; 2016;16(3):275–6. Available from: http://linkinghub.elsevier.com/retrieve/pii/S1473309916000487
  2. Mohindra RK. A case of insufficient evidence equipoise: the NICE guidance on antibiotic prophylaxis for the prevention of infective endocarditis. J Med Ethics [Internet]. 2010;36(9):567–70. Available from: http://jme.bmj.com.abc.cardiff.ac.uk/content/36/9/567
  3. Thompson W, Palmer NOA. Guideline comment: Infective endocarditis. Nat Publ Gr [Internet]. Nature Publishing Group; 2015;219(7):303. Available from: http://dx.doi.org/10.1038/sj.bdj.2015.761
  4. Endocarditis I. FGDP(UK) supports NICE decision on guidance for prophylaxis against infective endocarditis. Bdj [Internet]. 2015;219(7):312–312. Available from: http://www.nature.com/doifinder/10.1038/sj.bdj.2015.789
  5. Dayer MJ, Jones S, Prendergast B, Baddour LM, Lockhart PB, Thornhill MH. Incidence of infective endocarditis in England, 2000-13: A secular trend, interrupted time-series analysis. Lancet [Internet]. Elsevier Ltd; 2015;385(9974):1219–28. Available from: http://dx.doi.org/10.1016/S0140-6736(14)62007-9
  6. Centre for Clinical Practice at NICE (UK). Prophylaxis against infective eendocarditis : antimicrobial prophylaxis against endocarditis in adults and children undergoing interventional procedures. 2015;(September).
  7. DJ Wheeler. Understanding variation – The Key to Managing Chaos. SPC Press; 1993.