Powered Air-Purifying Respirator (PAPR) use for prevention of highly infectious viral disease in healthcare workers

IMG_1132

Link to the Dental Elf

There has been a considerable amount of literature developed over the Coronavirus CoV-2 pandemic regarding the dental profession, aerosol generating procedures (AGP), airborne spread of the virus and the need for enhanced personal protective equipment (PPE).Though there is evidence that dental AGPs cause significant environmental contamination there is very little evidence linking this to direct infection of staff or patients (HPS, 2020).

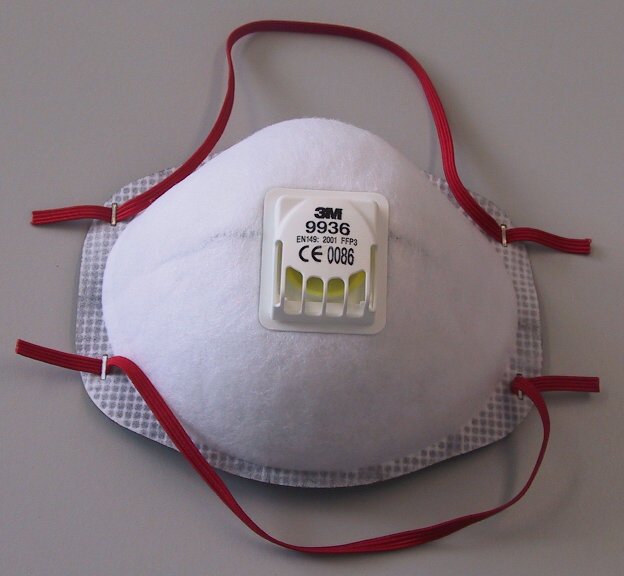
To reduce the potential risk of infection via the airborne route most national and international regulations (Clarkson et al., 2020) require that dental teams wear Face Filtering Piece level respiratory protection (FFP2/FFP3) in addition to standard PPE when performing AGPs. Following the SARS-Cov-1 outbreak in Toronto, Canada, powered air-purifying respirators (PAPRs) superseded the use of FFP respirators in the respiratory PPE protocols (Peng et al., 2003) however there is no mention of their existence as an alternative to FFP3 respirator in the PPE guidance from the Office of the Chief Dental Officer (England) (OCDO, 2020). This review is important due to limited information available regarding the practical efficacy between FFP2/FFP3 and PAPRs in the clinical environment.

Methods

This systematic review was reported according to the standards for the Preferred Reporting Items for Systematic Reviews and Meta-Analysis (PRISMA), and the protocol was prospectively registered with the International Register of Systematic Reviews (PROSPERO). Searches were undertaken using the electronic databases: Medline; Embase; Cochrane Library (Cochrane Database of Systematic Reviews and CENTRAL). Grey literature was sought through: Google Scholar, OpenGrey, and GreyNet. Searches were repeated up to June 2020, and only English language studies were included.

Studies were screened by two reviewers. Risk of bias in randomized controlled studies was assessed using the Cochrane Risk of Bias tool, and the ROBINS-I (Risk of Bias in Non-randomized Studies of Interventions) tool to assess the risk of bias in non-randomized studies. Quality of evidence was classified according to Grading of Recommendations, Assessment, Development and Evaluation (GRADE). Due to the heterogeneity of the small number of studies a narrative review was undertaken.

Results

  • 10 studies fulfilled the inclusion criteria out of a total of 690.
  • There was no difference in the primary endpoint of COVID-19 infection in respective observational studies in the airway proceduralists utilizing PAPR versus other protective respiratory equipment.
  • Healthcare workers reported Improved comfort with regards to heat tolerance and visibility with PAPR technology.
  • Decreased effort was needed to maintain the work of breathing compared to conventional filtering face pieces.
  • Lower contamination rates of skin and clothing in simulation studies of participants utilising PAPRs.
  • Decrease in audibility and communication difficulties due to increased weight of the equipment and noise generated by positive airflow.

Conclusions

The authors concluded: –

Field observational studies do not indicate a difference in healthcare worker infection utilizing PAPR devices versus other compliant respiratory equipment. Greater heat tolerance accompanied by lower scores of mobility and audibility in PAPR were identified. Further pragmatic studies are needed in order to delineate actual effectiveness and provider satisfaction with PAPR technology.

Comments

This was a well conducted systematic review considering the limitation in the number of studies. Due to the global nature of the pandemic more papers could possibly have been identified if the authors had not restricted the language search. There would appear to be numerous advantages identified in this review regarding the use of PAPRs such as increased assigned protection factors (APF >25), inbuilt eye protection, reusable, they don’t need fit testing, improved heat tolerance and comfort if worn for longer than 1 hour, and they can be worn without limiting facial hair.

Limitations include challenges in verbal communication due to the hum of the motor, maintenance and battery life, decontamination after use, and cost. Given the lack of demonstrable advantage in terms of infection prevention, institutional decision makers may be applying a pragmatic choice to use FFP3 over PAPR respirators, however there may be considerable physical and financial advantage for health care workers and dental staff who are required to work for extended periods.

Links

Primary Paper

Use of Powered Air-Purifying Respirator (PAPR) by healthcare workers for preventing highly infectious viral diseases -a systematic review of evidence. Ana Licina, Andrew J Silvers, Rhonda Stuart. medRxiv 2020.07.14.20153288;

Review protocol on PROSPERO

Other references

CLARKSON, J., RICHARDS, D. & RAMSAY, C. 2020. Aerosol Generating Procedures and their Mitigation in International Dental Guidance Documents – A Rapid Review.

OCDO. 2020. Standard operating procedure Transition to recovery  first published 4th June.[Online].  Accessed 1st Aug 2020].

PENG, P. W., WONG, D. T., BEVAN, D. & GARDAM, M. 2003. Infection control and anesthesia: lessons learned from the Toronto SARS outbreak. Canadian Journal of Anesthesia, 50, 989-997.

HPS 2020. SBAR: Assessing the evidence base for medical procedures which create a higher risk of respiratory infection transmission from patient to healthcare worker.

FFP3 fit testing accuracy and Covid-19 prevalence update

File:Atemluftfilter Einwegmaske.jpg - Wikimedia Commons

Link to Dental Elf

The Bottom Line

The prevalence of Covid-19 in England has dropped to 1:1000, reducing the risk of treating an asymptomatic/presymptomatic patient down to 1:3330. Depending on usage between 5% and 55% of fit tested FFP3 mask will truly fit correctly. As the prevalence of Covid-19 drops policy makers will need to be aware of the changing risk/benefits of complex PPE usage.

Introduction

On the 5th June the Office of National Statistics (ONS) updated their prevalence statistics for Covid-19 infections  down to 0.10% (95% CI: 0.05% to 0.18) of the population in England (ONS, 2020). From my previous two blogs the estimated true asymptomatic prevalence for Covid-19 was 16% (95% CI: 12% to 20%) and the combines asymptomatic/presymptomatic prevalence was estimated at 27% (95%CI; 12 to 45%). From this updated data it is now possible to revise down the chance of treating a Covid-19 patient from 1:1333 to 1:3330, so in 20 days the risk has reduces about 2.5 times.

At the same time we have had three major Standard Operating Procedures (SOPs) published by the British Dental Association, Faculty of General Dental Practitioners, and the Office of the Chief Dental Officer (England) (BDA, 2020, FGDP, 2020, OCDOE, 2020). A large proportion of these documents are dedicated to the aerosol generating procedures and the need for properly fit-tested FFP3 respirators. Below I have outlined the diagnostic accuracy of fit testing based on data from the Health and Safety Executive (HSE, 2015).

Methods

In 2015 the HSE produced a document specifically reviewing the fit test criteria for FFP3 respirators. In total 25 volunteers were tested with four consecutive fit test methods, qualitative Bitrex, quantitative Portacount (both with and without the N95-Companion technology), and the laboratory-generated salt aerosol (Total Inward Leakage – TIL) chamber fit test method, tests were conducted on the same subject wearing an FFP3, without adjustment to the fit between tests. I carried out a metanalysis using the ‘mada’ package in R, the reference test used was the laboratory test chamber (TIL) fit test. The summary estimate for the qualitative/quantitative fit-tests for sensitivity was 89.3% (95% CI: 80.1% to 96.7%) and for specificity 58.7% (31.7% to 56.1%). The results have also been charted on a  Summary Receiver Operating Characteristic (sROC) curve (See Figure 1.).

Figure 1. sROC curve for FFP3 fit test

fittest

The main problem with both the qualitative and quantitative tests is the low specificity which produces a high number of false negative results. The reference test found that  37% of the masks tested passed, so if we tested 1000 masks, we get the following results (see Figure 2.).

Figure 2. Frequency tree for fit tests

fit test_v3

From the frequency tree we can see that a false fail will appear as a pass, so if a clinician passes a standard fit test there is a 55% probability that the result is true. On refitting and passing a fit check 58% of FFP3 masks failed their fit-test, so in real-terms this reduces the overall pass rate to 31% of fit checked respirators passing their fit test if reused. In long term real-world usage this ability for a mask to retain the required level of filtration could drop as low as 5% with incorrect usage with 18% of theatre staff wearing their face masks incorrectly (Herron et al., 2019).

Attack rates, hospital AGPs and the relative protection of face masks

Interestingly I found a paper on real-world  SARS infection rates for acute care nursing staff performing medical AGPs (Loeb et al., 2004). The infection rate with SARs according to consistently used FFP2 respirators was 13%, and for surgical masks it was 25%, with inconsistent use this rose to 56%. Combining this data with the updated prevalence data we can model the revised infection natural frequencies (see Table 1.).

Table 1. Face mask protection model

Mask usage Infection rate Protection factor Infection risk
Base rate 100% 1.0 1:3330
Inconsistent mask usage 56% 1.7 1:5661
Surgical face mask 25% 4.0 1:13320
FFP2 13% 7.7 1:25641


The problem now is that when the data is placed into an apriori power calculator (G*Power 3.19.2) with an error probability is 0.05 and power (1-beta error probability) of 0.8 one will need a total sample size of 1087610 to test mask effectiveness.

Conclusion

The prevalence of Covid-19 in the population has changed dramatically over the past three weeks, this will have knock on effects regarding the real-world exposure risks of clinical staff to Covid-19 and the application of the advice given in the current SOPs. Clinicians need to be aware of the high failure rates in the true protection offered from properly fit tested FFP2 and FFP3 masks, and as the risk status drops the clinical benefit of these respirator mask  will be harder to detect.

References

BDA. 2020. RETURNING TO FACE-TO-FACE CARE [Online]. Available: https://bda.org/advice/Coronavirus/Pages/returning-to-work.aspx [Accessed].

FGDP. 2020. Implications of COVID-19 for the safe management of general dental practice A practical guide [Online]. Available: https://www.fgdp.org.uk/implications-covid-19-safe-management-general-dental-practice-practical-guide [Accessed].

HERRON, J. B. T., KUHT, J. A., HUSSAIN, A. Z., GENS, K. K. & GILLIAM, A. D. 2019. Do theatre staff use face masks in accordance with the manufacturers’ guidelines of use? J Infect Prev, 20, 99-106.

HSE. 2015. Review of fit test pass criteria for Filtering Facepieces Class 3 (FFP3) Respirators [Online]. Available: https://www.hse.gov.uk/research/rrpdf/rr1029.pdf [Accessed].

LOEB, M., MCGEER, A., HENRY, B., OFNER, M., ROSE, D., HLYWKA, T., LEVIE, J., MCQUEEN, J., SMITH, S. & MOSS, L. 2004. SARS among critical care nurses, Toronto. Emerging infectious diseases, 10, 251.

OCDOE. 2020. Standard operating procedure transition to recovery [Online]. Available: https://www.england.nhs.uk/coronavirus/publication/preparedness-letters-for-dental-care/ [Accessed].

ONS. 2020. Coronavirus (COVID-19) Infection Survey pilot: 5 June 2020 [Online]. Available: https://www.ons.gov.uk/peoplepopulationandcommunity/healthandsocialcare/conditionsanddiseases/bulletins/coronaviruscovid19infectionsurveypilot/5june2020 [Accessed].


Covid-19: Asymptomatic/presymptomatic and the next patient?

File:CDC 2019-nCoV Laboratory Test Kit.jpg - Wikimedia Commons

Link to Dental Elf

Bottom line

To date we are seeing a small reduction in Covid-19 prevalence in England, the number of asymptomatic patients being about 13% of those who test positive for SARS-CoV-2. Applying a prediction interval to the latest systematic review suggests the chance of encountering an asymptomatic patient varies between 1% and 78% of those who would test positive. Without rapid and accurate virus and antibody testing at present extreme care still needs to be taken regarding dental aerosol generating procedures to protect both patients and staff. Self-reporting infection without a confirmatory test is about 3% accurate.

Introduction

As with all Covid-19 related data more information is appearing and being updated every day. In this opinion paper I would like to discuss the differences between Covid-19 positive patients who are asymptomatic/presympromatic, and symptomatic; what the latest data locally and globally shows, and how to interpret the data presented when making clinical decisions of individual patient risk.

Methods

The definition of a presymptomatic patient is a person where SARS-CoV-2 is detected before symptom onset, and asymptomatic are persons where SARS-CoV-2 is detected but symptoms never develop. Symptomatic is therefore those persons where SARS-CoV-2 is detected, and they have symptoms (Furukawa et al., 2020). In a cross-sectional study, one cannot separate the two categories of asymptomatic and presymptomatic as the data collected only refers to a specific time point such as the 3rd of May. If a longitudinal study is undertaken over a couple of weeks, then it may be possible to detect the patients who later go on to develop symptoms.

The latest data from the ONS, updated on the 28th May revised its prevalence estimate down to 0.24% of the community with COVID-19 (95% confidence interval: 0.11% to 0.46%) based on tests performed on 18,913 people in 8,799 households (ONS, 2020). Between the 26th April and the 25th May of those participants who reported symptoms 2.62% (95% CI: 1.56% to 4.11%) also tested positive, compared to an estimate of 0.35% of those not reporting any symptoms on the day of the test (95% CI: 0.30% to 0.47%). From this we could conclude that the sensitivity of self-reporting  coronavirus infection without a confirmatory test is 2.62% accurate, and of those individuals with a positive test 13.36% were asymptomatics on the day (both true asymptomatics and presymptomatics).

A recent systematic review by Byambasuren and co-workers set out to estimate the extent of true asymptomatic individuals and the associated risk of community spread (Byambasuren et al., 2020). Their inclusion criteria required  people of any age who were at-risk of contracting SARS-CoV-2 virus, and diagnosed by laboratory-based real time quantitative reverse transcription polymerase chain reaction (RT-qPCR) or serological tests to be positive. These people remained symptomless throughout the follow up period of at least 7 days to distinguish them from pre-symptomatic cases. From the 5 papers that fulfilled these criteria they undertook a meta-analysis and concluded using a fixed-effect model that the proportion of asymptomatic cases was 16% (95% CI: 12% – 20%) (See Figure 1.)

Figure 1.Fixed effects pooled estimates of proportion of asymptomatic carriers

Asymp_fixed

The authors used a fixed effects model possibly due to the small number of studies with similar methodologies. If, however a prediction interval (Borenstein et al., 2011) was added to the same data using the ‘meta’ package in R the summary estimate remains the same but the distribution of true effect sizes one could expect in future studies could be as low as 1% and as high as 78% (See Figure 2.).

Figure 2. Fixed effects pooled estimates of proportion of asymptomatic carriers plus prediction interval

Asmpto_fixed

Discussion

When interpreting the summary estimate within a systematic review it must be remembered this represents the mean and error variability between the different study results, and not the true distribution of asymptomatic Covid-19 carries that one may encounter tomorrow in your practice. In other words, it would not be impossible for you to encounter a group of patients (say a family) where 78% are true asymptomatic patients. As researchers produce more high-quality studies (preferably ≥24) this prediction interval will drop sharply down but unlike a confidence interval never approach zero.

References

BORENSTEIN, M., HEDGES, L. V., HIGGINS, J. P. & ROTHSTEIN, H. R. 2011. Prediction IntervalsI. Introduction to meta-analysis. John Wiley & Sons.

BYAMBASUREN, O., CARDONA, M., BELL, K., CLARK, J., MCLAWS, M.-L. & GLASZIOU, P. 2020. Estimating the extent of true asymptomatic COVID-19 and its potential for community transmission: systematic review and meta-analysis. medRxiv.

FURUKAWA, N., BROOKS, J. & SOBEL, J. 2020. Evidence Supporting Transmission of Severe Acute Respiratory Syndrome Coronavirus 2 While Presymptomatic or Asymptomatic. Emerging infectious diseases, 26.

ONS. 2020. Coronavirus (COVID-19) Infection Surveypilot: England, 28 May 2020 [Online]. Available: https://www.ons.gov.uk/peoplepopulationandcommunity/healthandsocialcare/conditionsanddiseases/bulletins/coronaviruscovid19infectionsurveypilot/28may2020 [Accessed].

Disclaimer:  The article has not been peer-reviewed; it should not replace individual clinical judgement, and the sources cited should be checked. The views expressed in this commentary represent the views of the author and not necessarily those of the host institution. The views are not a substitute for professional advice.