The Bottom Line
The prevalence of Covid-19 in England has dropped to 1:1000, reducing the risk of treating an asymptomatic/presymptomatic patient down to 1:3330. Depending on usage between 5% and 55% of fit tested FFP3 mask will truly fit correctly. As the prevalence of Covid-19 drops policy makers will need to be aware of the changing risk/benefits of complex PPE usage.
Introduction
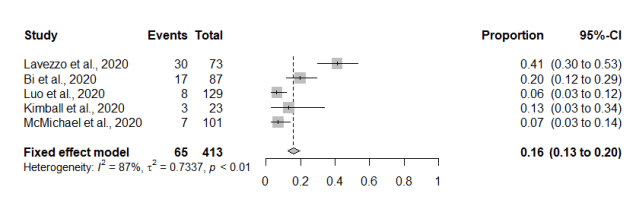
On the 5th June the Office of National Statistics (ONS) updated their prevalence statistics for Covid-19 infections down to 0.10% (95% CI: 0.05% to 0.18) of the population in England (ONS, 2020). From my previous two blogs the estimated true asymptomatic prevalence for Covid-19 was 16% (95% CI: 12% to 20%) and the combines asymptomatic/presymptomatic prevalence was estimated at 27% (95%CI; 12 to 45%). From this updated data it is now possible to revise down the chance of treating a Covid-19 patient from 1:1333 to 1:3330, so in 20 days the risk has reduces about 2.5 times.
At the same time we have had three major Standard Operating Procedures (SOPs) published by the British Dental Association, Faculty of General Dental Practitioners, and the Office of the Chief Dental Officer (England) (BDA, 2020, FGDP, 2020, OCDOE, 2020). A large proportion of these documents are dedicated to the aerosol generating procedures and the need for properly fit-tested FFP3 respirators. Below I have outlined the diagnostic accuracy of fit testing based on data from the Health and Safety Executive (HSE, 2015).
Methods
In 2015 the HSE produced a document specifically reviewing the fit test criteria for FFP3 respirators. In total 25 volunteers were tested with four consecutive fit test methods, qualitative Bitrex, quantitative Portacount (both with and without the N95-Companion technology), and the laboratory-generated salt aerosol (Total Inward Leakage – TIL) chamber fit test method, tests were conducted on the same subject wearing an FFP3, without adjustment to the fit between tests. I carried out a metanalysis using the ‘mada’ package in R, the reference test used was the laboratory test chamber (TIL) fit test. The summary estimate for the qualitative/quantitative fit-tests for sensitivity was 89.3% (95% CI: 80.1% to 96.7%) and for specificity 58.7% (31.7% to 56.1%). The results have also been charted on a Summary Receiver Operating Characteristic (sROC) curve (See Figure 1.).
Figure 1. sROC curve for FFP3 fit test
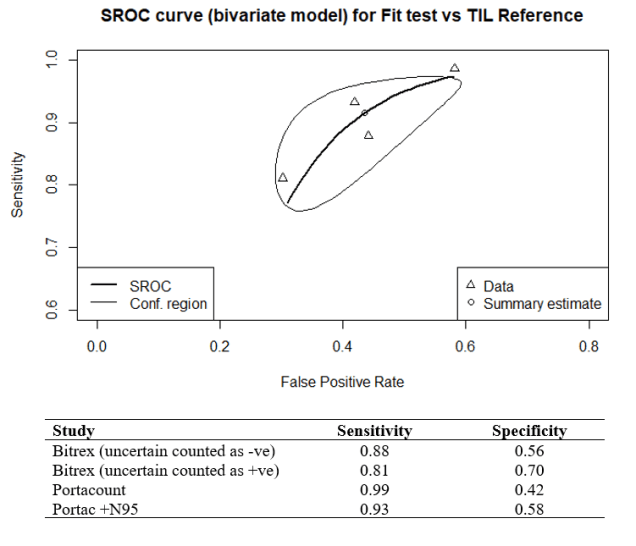
The main problem with both the qualitative and quantitative tests is the low specificity which produces a high number of false negative results. The reference test found that 37% of the masks tested passed, so if we tested 1000 masks, we get the following results (see Figure 2.).
Figure 2. Frequency tree for fit tests
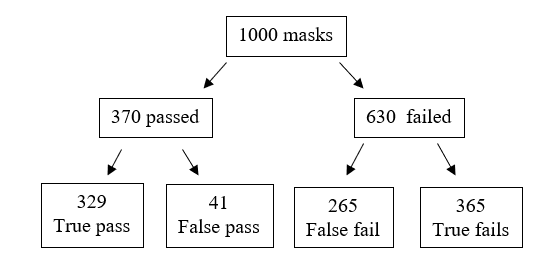
From the frequency tree we can see that a false fail will appear as a pass, so if a clinician passes a standard fit test there is a 55% probability that the result is true. On refitting and passing a fit check 58% of FFP3 masks failed their fit-test, so in real-terms this reduces the overall pass rate to 31% of fit checked respirators passing their fit test if reused. In long term real-world usage this ability for a mask to retain the required level of filtration could drop as low as 5% with incorrect usage with 18% of theatre staff wearing their face masks incorrectly (Herron et al., 2019).
Attack rates, hospital AGPs and the relative protection of face masks
Interestingly I found a paper on real-world SARS infection rates for acute care nursing staff performing medical AGPs (Loeb et al., 2004). The infection rate with SARs according to consistently used FFP2 respirators was 13%, and for surgical masks it was 25%, with inconsistent use this rose to 56%. Combining this data with the updated prevalence data we can model the revised infection natural frequencies (see Table 1.).
Table 1. Face mask protection model
| Mask usage | Infection rate | Protection factor | Infection risk |
| Base rate | 100% | 1.0 | 1:3330 |
| Inconsistent mask usage | 56% | 1.7 | 1:5661 |
| Surgical face mask | 25% | 4.0 | 1:13320 |
| FFP2 | 13% | 7.7 | 1:25641 |
The problem now is that when the data is placed into an apriori power calculator (G*Power 3.19.2) with an error probability is 0.05 and power (1-beta error probability) of 0.8 one will need a total sample size of 1087610 to test mask effectiveness.
Conclusion
The prevalence of Covid-19 in the population has changed dramatically over the past three weeks, this will have knock on effects regarding the real-world exposure risks of clinical staff to Covid-19 and the application of the advice given in the current SOPs. Clinicians need to be aware of the high failure rates in the true protection offered from properly fit tested FFP2 and FFP3 masks, and as the risk status drops the clinical benefit of these respirator mask will be harder to detect.
References
BDA. 2020. RETURNING TO FACE-TO-FACE CARE [Online]. Available: https://bda.org/advice/Coronavirus/Pages/returning-to-work.aspx [Accessed].
FGDP. 2020. Implications of COVID-19 for the safe management of general dental practice A practical guide [Online]. Available: https://www.fgdp.org.uk/implications-covid-19-safe-management-general-dental-practice-practical-guide [Accessed].
HERRON, J. B. T., KUHT, J. A., HUSSAIN, A. Z., GENS, K. K. & GILLIAM, A. D. 2019. Do theatre staff use face masks in accordance with the manufacturers’ guidelines of use? J Infect Prev, 20, 99-106.
HSE. 2015. Review of fit test pass criteria for Filtering Facepieces Class 3 (FFP3) Respirators [Online]. Available: https://www.hse.gov.uk/research/rrpdf/rr1029.pdf [Accessed].
LOEB, M., MCGEER, A., HENRY, B., OFNER, M., ROSE, D., HLYWKA, T., LEVIE, J., MCQUEEN, J., SMITH, S. & MOSS, L. 2004. SARS among critical care nurses, Toronto. Emerging infectious diseases, 10, 251.
OCDOE. 2020. Standard operating procedure transition to recovery [Online]. Available: https://www.england.nhs.uk/coronavirus/publication/preparedness-letters-for-dental-care/ [Accessed].
ONS. 2020. Coronavirus (COVID-19) Infection Survey pilot: 5 June 2020 [Online]. Available: https://www.ons.gov.uk/peoplepopulationandcommunity/healthandsocialcare/conditionsanddiseases/bulletins/coronaviruscovid19infectionsurveypilot/5june2020 [Accessed].