‘All models are wrong, but some are useful’ George Box

The Bottom Line
It is important when developing national and local guidelines to appreciate the extremely high variability in clinical risk that Covid-19 poses to the dental team, and the patients they serve. Regarding the use of PPE and aerosol generating procedures there should be sufficient flexibility in the national guidelines to allow clinicians to safely apply their local knowledge so that the PPE selected matches the degree of risk for the individuals. Applying a rigid, unsustainable PPE policy will waste valuable resources while increasing potential harm to staff and patients.
Background
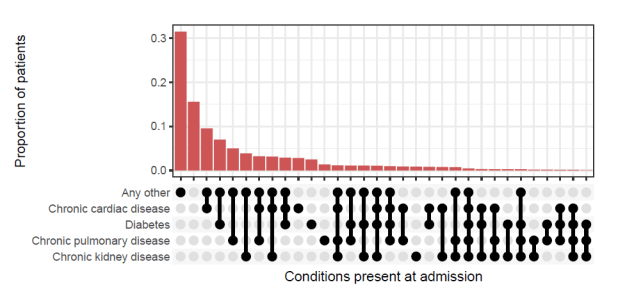
During the Q&A section of a webinar I was recently presenting about evidence-based dentistry one of the participants made a very interesting point. As a surgeon working in the front line of the Covid-19 pandemic not all areas have been effected the same, in some areas of the country we have hardly seen any deaths in the community, and in a North London hospital the staff there are seeing many severe cases a day. This point that the infection is not evenly distributed either geographically nor demographically is important, as it highlights the ‘tyranny of the average’(Merlo et al., 2017) in terms of healthcare policy and guideline development. From the data this virus is not an ‘equal opportunities killer’ as the highest mortality rates are effecting the frail, disadvantaged, and highlighting strong racial/ethnic inequalities (Webb et al., 2020, Everson et al., 2002). A clear example of this is that out of 23,804 Covid-19 related deaths 31.4% (7466) occurred in people with Type II diabetes (prevalence in pop. approx. 6%). 15% of Covid-19 admissions to hospital had no reported medical conditions, but 50% had three or more significant comorbidities (ISARIC, 2020) (See Figure 1.).
Figure 1.The distribution of combinations of the four most common chronic diseases (ISARIC 2020)
An example of this variation can be seen in regional mortality figures for England. Mortality with a diagnosis of Covid-19 is the only reliable endpoint measurement until we have large scale reliable track and trace/antibody tests. From the background information we can deduce that there appears to be significant variation between geographic locations with lower risk in the more rural counties and smaller cities by as much as a factor of 2.5.(Table 1).
Table 1. Differences in regional mortality up to 8th May
| Location | Population | Population density/km2 | Covid-19 deaths | % of population die of Covid-19 | Risk Ratio |
| Plymouth | 262100 | 8500 | 57 | 0.021 | 1 |
| Lincolnshire | 761224 | 127 | 207 | 0.027 | 1.29 |
| Manchester | 552858 | 4716 | 289 | 0.052 | 2.48 |
| Tower Hamlets | 324745 | 16000 | 172 | 0.053 | 2.52 |
Methods
The following calculations are a Fermi problem after Enrico Fermi, where an estimate is made with little or no data and used to identify orders of magnitude rather than point estimates. The methodology undertaken uses the mathematical principles laid out by Pólya in his famous book ‘How to Solve it’ (Polya, 1945). These are
- Understand the problem.
- Find the connection between the data and the unknown and devise a plan.
- Run the model.
- Examine the solution.
In a previous post I looked at base rates as a point estimate by using the mean without a confidence interval (Howe, 2020). Since then two reviews have been published investigating the infection fatality rate (IFR) (Ioannidis, 2020, Meyerowitz-Katz and Merone, 2020). The IFR estimates the overall mortality rather than the number of deaths as a proportion of confirmed cases (CFR). Due to variations in analysis the two reviews produce significantly different results, Ioannidis’s review produces as IFR range of 0.02% to 0.40%, and the Meyerowitz-Katz review a mean of 0.75% (95% CI: 0.49 to 1.01). The results from the Office of National Statistics (ONS) data for infection in England was 0.27% (95% CI: 0.17% to 0.41%). To calculate the risk range of dying following a dental aerosol generating procedure (AGP) is based on the assumption that there is a 100% chance of becoming infected in a single exposure to the virus, the second assumption is that we work with both the minima and the maxima as presented. The summary estimate for asymptomatic individuals in the population was previously calculated as 0.27% (95% CI: 0.12% to 0.45%) (Howe, 2020).
Figure 2. Frequency tree for maximum and minimum AGP risk

With this new range of asymptomatic risk as 1:540 to1:5000 we can calculate the risk that this infected patient passes on the virus to another patient or member of staff and they unfortunately die. We do not treat symptomatic Covid-19 patients in this model. The final range of AGP related death ranges from 1: 54000 to 1:25,000,000 (See Table 3.).
Table 3. Minimum and maximum infection fatality risk
| IFR Review paper | Minimum and maximum risk of death(natural frequency) |
| Ioannidis, 2020 | 1: 135,000 to 1:25,000,000 |
| Meyerowitz-Katz and Merone, 2020 | 1: 54,000 to 1:1,020,000 |
Discussion
From the data presented we can make broad assumptions about the population most at risk form corona virus, namely the urban elderly with multiple chronic health conditions. We can also make a similar broad assumption that rural and less densely populated areas have had lower mortality rates. From the current IFR data the variability in trying to make an estimate of risk become incredibly wide from 1:54,000 to 1:25,000,000 which is a 462 times increase in risk. From this result we can see that even in the worst-case scenario the risk of a dental AGP being directly linked to an individual patients death is very low if good cross infection policy is employed which includes PPE as a component of the process. High level PPE (Fluid resistant disposable gowns with plastic aprons, FFP3 and visors) can soon lose its protective benefits with prolonged use, lack of comfort, complicated workflow and difficulties in removing (Phan et al., 2019a, Phan et al., 2019b). There is a huge variance in the volume of aerosol generated in a dental procedure from polishing a composite to removing a broken bridge. It is important in that case that any guidance developed around the use of PPE should consider this variability and set an absolute minimum standard, thus allowing the clinician to tailor the PPE requirement to local conditions/risk. Low risk AGPs could require a fluid resistant face mask and face shield/visor, and as the risk increases higher levels of PPE are added rather than going to maximum PPE in all circumstances (high volume suction is common to all procedures). Wasted resources will harm health care provision to the most vulnerable social groups disproportionally, so high quality studies will need to be rapidly developed to assess these risks.
EVERSON, S. A., MATY, S. C., LYNCH, J. W. & KAPLAN, G. A. 2002. Epidemiologic evidence for the relation between socioeconomic status and depression, obesity, and diabetes. Journal of psychosomatic research, 53, 891-895.
HOWE, M. S. 2020. Are we sleepwalking into PPE paralysis? [Online]. Available: https://www.nationalelfservice.net/dentistry/dental-workforce/sleepwalking-ppe-paralysis/ [Accessed].
IOANNIDIS, J. P. 2020. The infection fatality rate of COVID-19 inferred from seroprevalence data.
ISARIC. 2020. Data PlatformCOVID-19 Report 6 MAY 20 [Online]. Available: https://media.tghn.org/medialibrary/2020/05/ISARIC_Data_Platform_COVID-19_Report_6MAY20.pdf [Accessed].
MERLO, J., MULINARI, S., WEMRELL, M., SUBRAMANIAN, S. V. & HEDBLAD, B. 2017. The tyranny of the averages and the indiscriminate use of risk factors in public health: The case of coronary heart disease. SSM Popul Health, 3, 684-698.
MEYEROWITZ-KATZ, G. & MERONE, L. 2020. A systematic review and meta-analysis of published research data on COVID-19 infection-fatality rates. medRxiv.
PHAN, L. T., MAITA, D., MORTIZ, D. C., WEBER, R., FRITZEN-PEDICINI, C., BLEASDALE, S. C., JONES, R. M. & PROGRAM, C. P. E. 2019a. Personal protective equipment doffing practices of healthcare workers. Journal of occupational and environmental hygiene, 16, 575-581.
PHAN, L. T., SWEENEY, D., MAITA, D., MORITZ, D. C., BLEASDALE, S. C., JONES, R. M. & PROGRAM, C. D. C. P. E. 2019b. Respiratory viruses on personal protective equipment and bodies of healthcare workers. Infect Control Hosp Epidemiol, 40, 1356-1360.
POLYA, G. 1945. How to solve it: A new aspect of mathematical method, Princeton university press.
WEBB, H. M., NÁPOLES, A. & PÉREZ-STABLE, E. 2020. COVID-19 and Racial/Ethnic Disparities. JAMA.
Disclaimer: The article has not been peer-reviewed; it should not replace individual clinical judgement, and the sources cited should be checked. The views expressed in this commentary represent the views of the author and not necessarily those of the host institution. The views are not a substitute for professional advice.
