How trendy are dental implants?

The simple answer is ‘very‘.

If you type ‘missing teeth‘ into Google the dominant treatment mentioned on the first page of results is ‘implant‘.

wordle

Why is this?

Is it a better treatment for missing teeth than other options such as dentures and conventional bridges? In a Cochrane Review (which is an independent rigorous review of the quality and validity of healthcare research) the answer was a little disappointing for those of us expecting a clear cut answer. Their conclusion was:

“AUTHORS’ CONCLUSIONS: Based on trials meeting the inclusion criteria for this review, there is insufficient evidence to recommend a particular method of tooth replacement for partially edentulous patients.”

First, let’s look at the trend in published literature from Medline (the main database for medical research) and as we speak nine times more papers are published in 2015 on dental implants than any other main-stream clinical technique for dealing with missing teeth.

implant-snip


Currently,9 times more papers are published last year on dental implants than any other clinical technique for dealing with missing teeth. The biggest difference between old-school conventional dental treatments and implants is money. Unlike dentures and bridges implant treatment involves working in collaboration with the pharmaceutical/biotech industry who are capable of directly and indirectly sponsoring the research, and research is very expensive. This has been studied and been shown to potentially positively bias the result in about 30% of cases. 

Combine this with direct and more importantly indirect marketing and it can appear to the lay person there is only one GOLD STANDARD treatment, implants. The alternative treatment options don’t get the same amount of exposure. For indirect marketing, the modern term is astroturfing summed up nicely in this TEDx talk by Sharyl Atkinsson.

TAKE HOME MESSAGE: Dental implants are very good but so are all the other major treatment options done correctly. They just dont get as much exposure. The important message in evidence-based dentistry is that the treatment option, be that implant, denture, bridge or nothing must match up with:

  • The best research evidence
  • The clinical expertise of the team both clinical and technical
  • The patient’s expectations, preferences, ability to comply with the treatment, personal circumstances, finances both now and for future maintenance.

As an example implants might be the best option to restore a missing front tooth following a skiing accident where all the other teeth are perfect, a baby-boomer with lots of old failing fillings and crowns might benefit best from a new bridge and where there are many missing teeth a denture may still be the best treatment option.

Before you chose make sure you have discussed all the sensible options with your dentist and don’t be afraid to ask those awkward questions.

_dsc2364


Probabilitistic Decision Making

Micro-specialisation and prognosis overestimation

I am a general dental practitioner, a jack-of-all trades in the dental world and possibly becoming an endangered species. To keep updated I travel to a lot of international conferences that cover the dental disciplines such as implants, restorative dentistry, prosthetics, endodontics, and periodontics to name a few. To my mind dentistry is a speciality within general healthcare so the disciplines above should be considered as sub-specialities or micro-specialities of dentistry and over recent years there has been a shift away from the generalist to the specialist (1). What I observed was that each discipline is just a bit better than the other at saving or restoring teeth so at an implant based conference implants outperform root-fillings and vice-versa.  Now if one carefully adds up the success rates across the disciplines of all the treatment options it becomes greater than 100%, which it impossible. What is happening is, due to uncertainty the  clinicians have to use probabilistic data and by restricting the number of treatment options create  overestimates for the relative success or suitability of that treatment. This is a problem of ‘subadditivity’ and the ‘unpacking principle’:

Subadditivity – This is where the sum of two probabilities is greater than 1.0.

Unpacking – As more detail of a hypothesis is provided (unpacked) there is an increase in its estimated probability.

An EBSCO literature search using the search terms “unpacking principle or subaddition” and “medical decision making” produced  three relevant papers with no systematic reviews or meta-analysis(2–4).To summarise the results; in Cahan et al’s paper 65% of the doctors exhibited subadditivity with a mean probability of 137% and Redelmeier et al concluded that clinicians need to unpack a broad category of treatment opptions rather than compare a single treatment against unspecified options.

To help understand these concepts I have worked an example for you below:

“A patient attends a dental surgeon complaining of difficulty chewing due to a loss of lower back teeth. On one side are two premolars and on the other one premolar. Both last standing teeth need new crowns. The upper arch is intact.”

The option are as follows:

  1. No treatment ( I will ignore this options in this example.)
  2. Two milled crowns and a metal/acrylic denture.
  3. Two crowns and a single implant following the shortened arch concept(5).
  4. Two crowns and four single implants. (Maximised model)
  5. Two tooth-implant retained three unit bridges (F-I).

The 10-year survival estimates for the individual components of the above treatment are:

  1. Single metal-ceramic crown 94% (6).
  2. Single tooth implant 89% (7)
  3. Tooth-implant bridge 77% (7)
  4. Metal acrylic denture 50% (8)

Looking at the individual survival figures the best treatment options involve metal-ceramic crowns on vital teeth or single crown implants, the next option is the tooth-implant bridge and finally the denture. The intuitive choice of most people would be Option 4.  (Two crowns and four single implants) due to the high survival rates. Once one becomes aware of the effects of subaddition and unpacking however Option 4. is not such a strong option as it at first appears in terms of complications and maintenance costs (Table 1.)


Unit treatment option 10-year Survival P Complete Treatment options Options Complication free
Implant Single crown (SCI) 89 0.89 2 crowns ,1 implant 2 x SC,1x SCI 0.79
Single crown (SC) 94 0.94 2 crowns, I denture 2 x SC, Co/Cr 0.44
Cobalt chrome denture (Co/Cr P) 50 0.5 2 crowns,4 implants 2 x SC, 4 x SCI 0.55
Fixed-implant bridge (F-I) 70 0.7 2 Fixed-Implant bridges 2 x F-I 0.49

Table 1.


The avoid the cognitive error of subaddition the clinician/patient can only choose one option to follow, this is best represented as a pie-chart (Fig 1.).

TP1

Fig 1.

The conclusion when the treatment options are unpacked and compared is that the two bridges or the two crowns/four implants have about the same complication rate. The two crowns and the implant is the safest and the denture option has the highest failure rate.

There is however one more consideration and that is relative cost/benefit which is generally overlooked in the research literature. Fortunately, with the data above it is quite simple to calculate this using the concept of ‘expected value’ For this example I have used the total estimated cost of the treatment and multiplied it by the probability of a complication. To calculate the probability of any complication I used the formula (Table 2):

p(complication)=1-p(complication-free).

Treatment options Options Complication free Complications (P) Estimated Treatment Cost Estimated Value
2 crowns ,1 implant 2 x SC,1x SCI 0.79 0.21 3700 790
2 crowns, I denture 2 x SC, Co/Cr 0.44 0.56 2200 1228
2 crowns,4 implants 2 x SC, 4 x SCI 0.55 0.45 11200 4991
2 Fixed-Implant bridges 2 x F-I 0.59 0.41 6000 2443

Table 2.

TP2

Fig 2.

Hopefully it’s clear that initially the two crown, four implant option may be more appealing it does carry a significantly greater cost compared to the bridges. The safest treatment both in terms of cost and predictability is the shortened arch principle due to its simplicity.

The ‘take-home message’ is that as the number of treatment items increase for an individual, the risk of complications and cost can also increase. By taking a little time to ‘unpack’ the alternate treatment options it can help reduce overconfidence and clarify choice as part of the consent process.

References:

  1. Levin-Scherz J. What Drives High Health Care Costs. Harv Bus Rev [Internet]. 2010;88(4):72–3. Available from: http://www.ncbi.nlm.nih.gov/pubmed/20402058
  2. Redelmeier DA. Medical Decision Making in Situations That Offer Multiple Alternatives. JAMA J Am Med Assoc [Internet]. American Medical Association; 1995 Jan 25 [cited 2014 Mar 11];273(4):302. Available from: http://jama.jamanetwork.com/article.aspx?articleid=386588
  3. Liberman V, Tversky A, Redelmeier DA. The Psychology of Decision Making Probability Judgment in Medicine : 1995;
  4. Cahan A, Gilon D, Manor O, Paltiel O. Probabilistic reasoning and clinical decision-making: Do doctors overestimate diagnostic probabilities? QJM – Mon J Assoc Physicians. 2003;96(10):763–9.
  5. Käyser a F. Shortened dental arches and oral function. J Oral Rehabil. 1981;8(5):457–62.
  6. Reitemeier B, Hansel K, Kastner C, Weber A, Walter MH. A prospective 10-year study of metal ceramic single crowns and fixed dental prosthesis retainers in private practice set tings. J Prosthet Dent [Internet]. The Editorial Council of the Journal of Prosthetic Dentistry; 2013;109(3):149–55. Available from: http://dx.doi.org/10.1016/S0022-3913(13)60034-7
  7. PJETURSSON BE, LANG NP. Prosthetic treatment planning on the basis of scientific evidence. J Oral Rehabil [Internet]. 2008;35(s1):72–9. Available from: http://doi.wiley.com/10.1111/j.1365-2842.2007.01824.x
  8. Vermeulen a H, Keltjens HM, van’t Hof M a, Kayser  a F. Ten-year evaluation of removable partial dentures: survival rates based on retreatment, not wearing and replacement. J Prosthet Dent [Internet]. 1996 Sep;76(3):267–72. Available from: http://www.ncbi.nlm.nih.gov/pubmed/8887799


What is a guarded prognosis

How well do we validate patient consent?

If you have been in practice for a while there will be times when you become aware that the patient may have misunderstood the risk involved regarding to a proposed treatment or lack of treatment. Both parties may have agreed but not understood fully what they agreed to. This flies in the face of the basic tenets of valid consent. NHS Choices (1) defines valid consent as:

“For consent to be valid, it must be voluntary and informed, and the person consenting must have the capacity to make the decision.”

Assuming that our patients have capacity to give consent and have not been pressured into making a choice how do we make sure they are correctly informed: i.e. the person must be given all of the information in terms of what the treatment involves, including the benefits and risks, whether there are reasonable alternative treatments and what will happen if treatment doesn’t go ahead.

I believe the most important part of being correctly informed prior to giving consent is understanding the potential future risks of accepting or rejecting a course of treatment. To answer this a focused question was developed using a PICO approach.

“What methods of risk communication are used in the shared decision making process to gain valid consent in dentistry?”

Three searches were undertaken using PubMed, Cochrane Library and Tripdatabase. Both MeSH and free text word were used: “dentistry”, “dental”, or “oral-health”, “risk communication”, “shared decision making” and “valid consent”. PubMed and the Cochrane library produced zero matches and Tripdatabase found 27 systematic reviews but none of them matched the question.

How are we performing then?

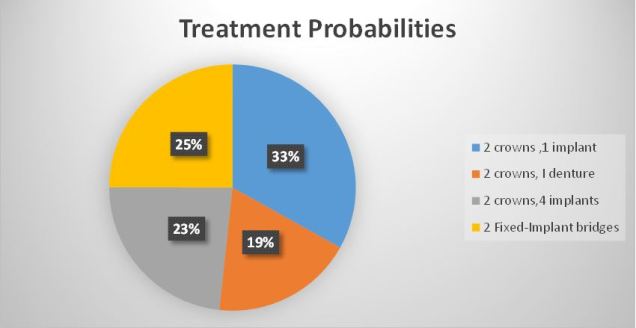
With no substantial evidence-base available a small experiment was set-up to see what six consultant grade restorative dentists did when writing out restorative treatment plans to convey the idea of clinical risk/benefit.

Eleven anonymised complex clinical cases were presented comprising of a brief dental history, presenting complaint, clinical images, radiographs, and study-casts. The clinicians were given ten minutes per case to assess the patient’s current dental health and future treatment then complete a proforma letter expressing their prognostic opinions as they would with a real patient. The clinicians were not allowed to confer during the experiment. The results were collected and tabulated below

Results

Words of Estimative Probability % occurrence in the text
Good 22
Poor 21
Guarded 18
Fair 10
Moderate 7
Unpredictable 4
Miscellaneous words used once or twice only 18


The analysis produced a lot of descriptive terms relating to prognosis/risk and outcome which come under the title of ‘words of estimative probability’ (WEPS). Only once (1/140) was there a time frame/numerical probability given. This use of WEPS only is however not an unusual occurrence, in fact as the results both from the literature review and small experiment show it’s the accepted practice.

If we really want to give our patients information that is clear and useful we need to look outside of the medical and dental guidelines and the Global Intelligence Community has been wrestling with this for a long time(2–4). This challenge with using descriptive words only was first documented by Sherman Kent in 1964 for the CIA in an attempt to improve intelligence briefings following the Bay of Pigs disaster in 1961. He proposed that numerical odds were added to the descriptive words to add clarity between analysts and the decision makers. Even though the logic of his argument was accepted it was never adopted until quite recently following 9/11 and Middle Eastern Crisis. The concern was that the numerical probability would be taken as a fact rather than as a probability and the forecaster could be accused of being wrong if the event did-not occur. This is what Philip Tetlock in his book ‘Superforecasting’(5) calls ‘the wrong-side-of-maybe’ fallacy. So if the weather forecast says there is a 60% chance of rain and it does not rain the forecaster is judged as being wrong. Hence the preference to use words that can be interpreted elastically. In practice 90% success relates to the success rate of the clinician, for 1-in-10 of the patients the treatment has 100% failed

Building better consent.

The question then is, can using numeric probabilities help in communicating risk to our patients? Similar to Sherman Kent I divided the commonly used WEPS and ascribed rough probabilities of success to these.

Words of Estimative Probability % occurrence
Excellent 93% +/- 6%
Good 75% +/- 12%
Fair 50% +/- 10%
Guarded 30% +/- 10%
Poor 7% +/- 7%


The first test was to see how patients interpreted the words without any numbers or probabilities to anchor off. We asked sixty consecutive general practice patients without asking the same patient twice what chance of success (excellent, good, fair, guarded or poor) meant. This duplicated some of the method de Bruin(6) used to answer the question ‘What is 50/50?’.. An example of the proforma given to the patient is indicated below

“Thank-you for helping in this research project on patient consent

If a health care professional said the success of your operation was ‘insert WEP’ could you please indicate on the scale below where you think the outcome would be.

The scale is between ‘0’ (no chance) to ‘100’ (absolutely certain).”

 probability scale


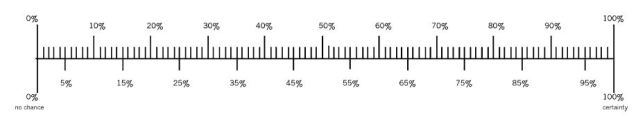
The patients were asked not to over-think the question but go with their first instinct and no additional guidance was given. The result where charted below using a Box plot.


box plot 1

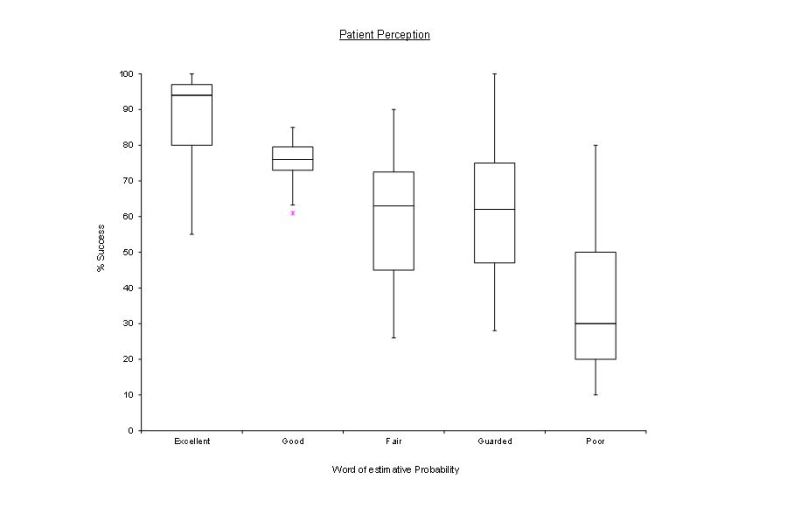
Fig.1 Patient perception of risk with words only.

The exercise was then repeated adding a numerical reference so excellent (9/10), good (8/10), fair (5/10, guarded (3/10) and poor (1/10)

box plot 2

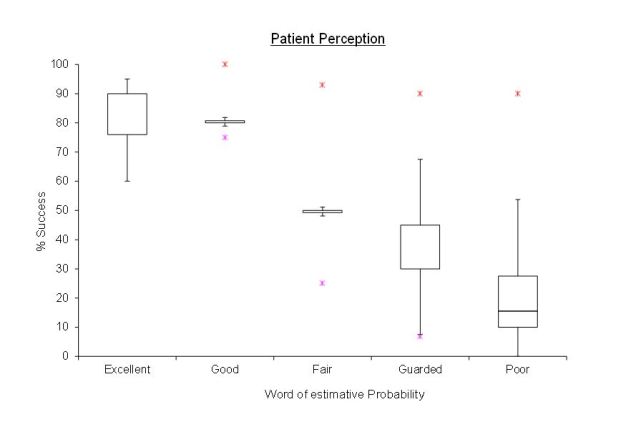
Fig.2 Patient perception of risk with words and numerical probability added

From the results on the box plots we can see on both charts a trend downwards from excellent to poor  Without the numbers there is greater optimism and overlap in interpretation and ‘guarded’ is overestimated by about 30 % with outliers from 30% to 90%. Once the numbers were included much better resolution was achieved with the median figures being closer to the expected values. One must note however that there were still huge outliers in the interpretation as marked by the red asterisk on the second chart.

Conclusion.

To gain valid consent clinicians need to understand that what they are saying does not necessarily align clearly with what the patient is understanding and there is a general trend to over-optimism. This can lead to an exaggerated sense of disappointment should a treatment fail and a sense of frustration from the clinician who feels they explained the risks prior to treatment. To narrow this gap, it is clear that adding a time frame and chance of success helps such as the ‘10-year success is good (7/10)’. The probability could be from 1-10, 1-5 or a star ratings more commonly seen on rating websites but it is quick and helps to anchor the patient closer to the clinician interpretation of the words used. Caution should however also be exercised as even with the inclusion of description, time and probability there were still large outliers in how the patients interpreted the information. In a paper about prognostic disclosure in cancer care(7) patients wanted a frank detailed prognoses but they also they want good news and the clinician to be optimistic. Though this task may be impossible I hope with a few simple additions we can add a little bit more clarity to the task of consent.

Bibliography.

  1. NHS. Consent to Treatment [Internet]. Available from: http://www.nhs.uk/conditions/consent-to-treatment/pages/introduction.aspx#definition
  2. Kent S. Words of Estimative Probability [Internet]. Journal of the American Intelligence Professional. 1964. p. 49–65. Available from: https://www.cia.gov/library/center-for-the-study-of-intelligence/kent-csi/vol8no4/html/v08i4a06p_0001.htm\nhttps://www.cia.gov/library/center-for-the-study-of-intelligence/kent-csi/vol8no4/pdf/v08i4a06p.pdf
  3. Kreuter N. The US Intelligence Community’s Mathematical Ideology of Technical Communication. Tech Commun Q [Internet]. 2015;24(3):217–34. Available from: http://www.tandfonline.com/doi/full/10.1080/10572252.2015.1044122
  4. Barnes A. Making Intelligence Analysis More Intelligent: Using Numeric Probabilities. Intell Natl Secur [Internet]. 2015;4527(October):1–18. Available from: http://www.tandfonline.com/doi/full/10.1080/02684527.2014.994955
  5. Tetlock PG dan. Superforecasting The Art & Science of Prediction. London: Random House and Penguin; 2015.
  6. de Bruin WB, Fischhoff B, Millstein SG, Halpern-Felsher BL. Verbal and Numerical Expressions of Probability: “It’s a Fifty–Fifty Chance.” Organ Behav Hum Decis Process [Internet]. 2000;81(1):115–31. Available from: http://linkinghub.elsevier.com/retrieve/pii/S0749597899928686
  7. Lamont EB, Christakis NA. Prognostic Disclosure to Patients with Cancer near the End of Life. Ann Intern Med. 2001;134:1096–105.