Restorative Dentistry Risk Index Retrospective Test
To test the accuracy of the Restorative Dental Risk Index (RDRX) in predicting the survival of various dental treatments I carried out an audit of my own patients who had been with the practive for 10 years. To add perspective to the results I compared it to the Oral; Health Score (OHS), a modified commercial version of this is known as Previsor. I have removed the post describing the RDRX to revise it slightly, it will be back by this week-end.
Method
Since we cannot have a 10 year no-treatment control I have used the Oral Health Score (OHS) as described by Burke and Busby as the control. As this is a health score it is by definition the inverse of the risk score so I have modified it by subtracting the OHS from 100 for comparison purposes (100-OHS).
Accessing Software of Excellence Excel I selected all current patients who first attended the practice between January and December 2005. I selected 10 years since the RDRX score was developed on 10 year survival/success meta-analysis data.
The query produced 47 sets of notes. I have assumed the effect size would be large 0.5, p=0.05 and power 0.8 so using G-Power 3.1 software the minimum sample size necessary was 21. I used a computer program to randomly selected 27 records from the 47 for review.
For each set of notes I counted the number of adverse events (failures and complications) and generated a RDRX score and 100-OHS based on the first visit. All major treatment provided in the past 10 years was categorised and recorded with the exception of maintenance and monitoring. (Data available on request)
Results and Analysis
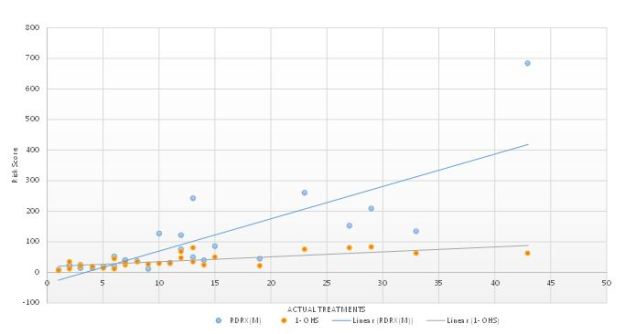
When comparing the risk scores with actual treatment both scoring systems perform well.
100 –OHS has a correlation coefficient 0.72
RDRX has a correlation coefficient 0.80
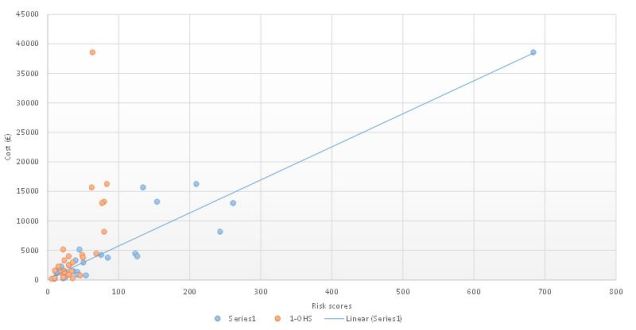
The second important comparison was the correlation between risk and estimated treatment cost
100 –OHS has a correlation coefficient 0.63
RDRX has a correlation coefficient 0.95
I have also calculated a t-test between the two risk scores /actual treatment (one tailed) data sets. The value of t=2.38. The value of p is 0.013. The result is significant at p<0.05.
Conclusion
We can reject the null hypothesis that there is no difference between the two indices. There is an improvement is resolution when comparing the RDRX with actual treatment as we are not restricted by a maximum value of 100. This is even more obvious when comparing risk score with treatment costs.
Clinical risk is fat tailed where the highest risk patient inhabit the extremes and therefore we need to clearly identify the outliers. On a practical basis the RDRX is more objective by avoiding subjective input from the patient which in the OHS makes up 24% of the score. Additionally it is quicker and easier to directly audit as there is a tooth by tooth assessment rather than by sextant.
The utilisation of independent probabilistic tooth assessment and then the use of risk multipliers produces a clearer model of restorative situation and additionally can easily be converted from a score into a probability that can be verified by Brier Scoring (I will save that for another day).
The RDRX used in conjunction with words of estimative (WEP) probability fulfils the two further requirements of good risk communication which are: numerical magnitude and time frame.
The next stage I hope is to independently verify this data on a wider and more diverse population sample.
