Dr Mark-Steven Howe BDS DGDP MGDS RCS MSc(Oxon) FCGDent
Abstract
Objectives: This study introduces a novel, evidence-based restorative risk assessment tool designed to help dental practitioners optimise long-term treatment options for individual patients.
Methods: The tool is grounded in two core concepts. First, patients are viewed as complex adaptive systems, composed of interacting components that behave in non-linear and often unpredictable ways. Second, given the uncertainty in both the evidence base and patient-specific data, plausible inference is used to interpret risk in a meaningful manner.
Using pooled 10-year survival data, the tool estimates the plausible probability of a complication-free outcome, defined as no significant repair, replacement, or removal of a tooth, implant, or prosthesis over a decade. Each restoration is assigned a prognostic value of 1 (poor), 7 (average), or 9 (excellent). An overall risk multiplier is then applied, taking into account systemic health, periodontal condition, and occlusal stability. The output produces a probability value that reflects the patient’s likely 10-year complication-free status.
Results: The tool provides a straightforward yet structured method for clinicians to evaluate a patient’s current restorative stability and predict the likelihood of future complications.
Conclusions: By incorporating principles of complexity science and plausible inference, this new risk index helps clinicians provide more objective, evidence-informed guidance during treatment planning and consent discussions. It also enables practitioners to model and compare future treatment scenarios and estimate related cost benefits. While conceptually robust, further research is needed to validate its clinical effectiveness in diverse settings.
Clinical Significance: The design of this novel risk assessment tool accepts the existence of complexity and missing data when estimating a patient’s 10-year complication-free dental restorative status. By using probabilities, it supports clinicians in delivering clearer, evidence-informed treatment planning and consent, while enabling comparison of future scenarios and potential cost benefits.
To allow dental implant placement in the posterior maxilla, it is sometimes necessary to increase the height of the residual alveolar bone of the maxillary sinus floor by undertaking a sinus lift procedure. The historical material of choice has been autogenous bone (AB), but this can lead to donor-site morbidity following harvesting. To simplify this process of sinus augmentation, several substitute materials have been studied, such as xenografts in the form of deproteinised bovine bone, synthetic grafts, growth factors, and platelet concentrates. There have been three recent systematic reviews utilising standard pairwise meta-analyses to investigate the efficacy of these biomaterials as a substitute for AB (Corbella et al., 2016; Danesh-Sani et al., 2017; Ting et al., 2017). The authors chose to undertake a Bayesian network meta-analysis (NMA) to evaluate and rank all these materials simultaneously in their capacity to form new bone. (Trimmel et al., 2021)
Methods
The study protocol was registered in PROSPERO (International Prospective Register of Systematic Reviews) and followed the Preferred Reporting Items for Systematic Reviews and Meta-analysis for Network Meta-analysis (PRISMA-NMA) guidelines (Hutton et al., 2015). A systematic search for suitable randomised control trials (RCTs) was performed in the Cochrane Library (CENTRAL), EBSCO, Embase, MEDLINE (via PubMed), and Web of Science Core Collection electronic databases with records published up to October 1, 2019. The risk of bias was assessed using the Cochrane Risk of Bias Tool.
The Bayesian approach for NMAs describes the range and probability of the parameter of interest (e.g., treatment effect here being bone % bone regeneration). The posterior distribution produced by this method predicts the new range and probability of plausible values for these parameters with the representation of uncertainty in the form of a 95% credibility interval. The interventions were ranked by their posterior probability by calculating the surface under the cumulative ranking (SUCRA) curve values.
Results
34 RCTs (842 maxillary sinus augmentations) with an average healing period of 5–8 months were included in the NMA. 31 were two-arm studies, and 3 were three-arm studies.
There were 28 treatment options, 378 possible pairwise comparisons, and 31 pairwise comparisons using direct data.
The overall assessment for risk of bias showed low risk in 5 studies, unclear risk in 20 studies, and high risk in 9 studies.
There were significant differences favouring the bovine bone + bone marrow concentrate (BMC) composite graft and the biodegradable copolymer; and between the bovine + BMC composite graft and the allograft.
From the 376 pairwise comparisons, no significant differences were detected, leading to a rejection of the null hypothesis that AB alone is the most favourable material for bone regeneration.
The SUCRA ranking probability for the most effective bone grafting material for new bone regeneration:-
Top Five Grafting Materials
SUCRA ranking
Bovine xenograft + bone marrow concentrate (BMC)
81%
Bovine xenograft + platelet-rich plasma (PRP)
77%
Bioactive glass ceramic + autologous bone 1:1
70%
Nanocrystalline hydroxyapatite in silica gel
70%
Bioactive glass-ceramic
70%
Autologous bone graft
57%
Conclusions
The authors concluded:-
The results of the present NMA suggest that the use of biomaterials does not result in a statistically significant difference in the rate of NB formation compared to AB alone as grafting material. However, their use can significantly reduce the amount of AB graft required for MSA, resulting in a less invasive surgical intervention and shorter surgical time. The combination of biomaterials with AB or autologous cell concentrates, such as BMC, PRP, and platelet-rich fibrin, represents a feasible alternative for AB substitution to achieve high NB formation. The superiority of AB compared to biomaterials for MSA in a healing time frame of 5–8 months cannot be justified.
Comments
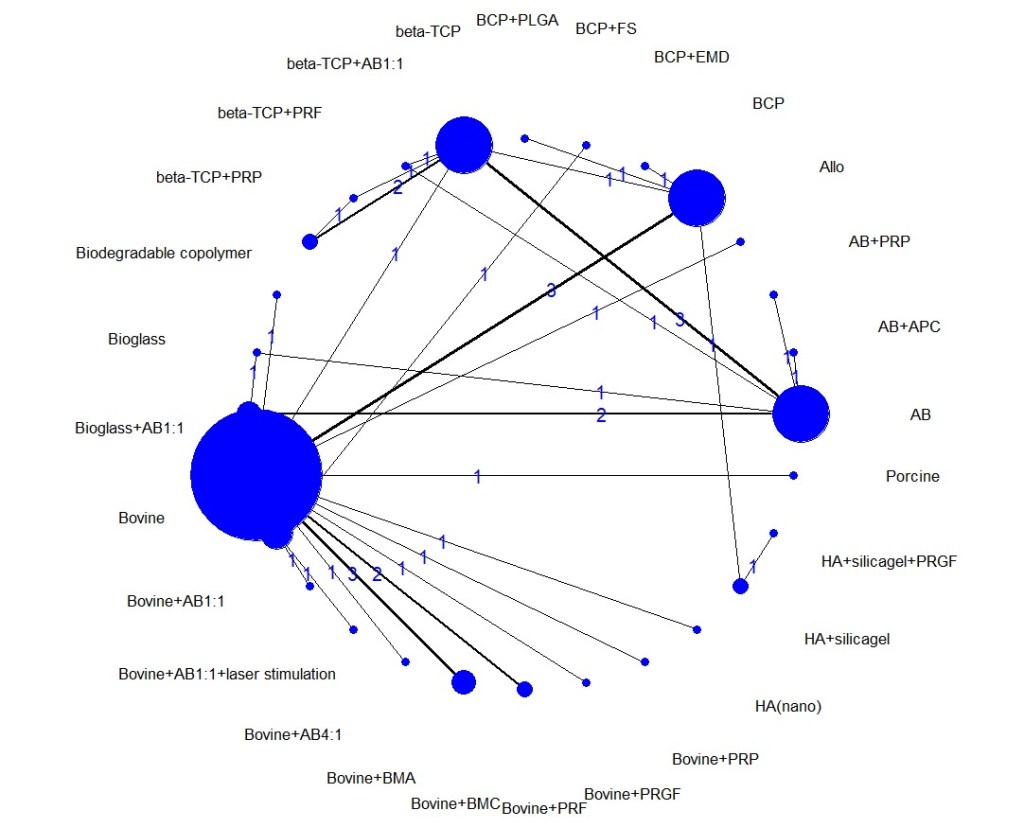
Network meta-analyses are highly complex statistical tools to evaluate multiple treatment options. This complexity can limit the strength and certainty of the inferences produced even when the NMA is well done, as in this case. In a two-part paper by Foote, Chaudhry and co-workers, they outline a practical guide on interpreting NMAs (Foote et al., 2015; Chaudhry et al., 2015). It should be noted that even though this NMA had a high number of treatment nodes, it was a sparse network with a network density of about 10%, whereas a full connected (dense) network would achieve 100%. The sparsity of connections increases the reliance on indirect evidence and the effects of heterogeneity within the included studies, leading to extremely wide confidence/credibility intervals and questionable results (Brignardello-Petersen et al., 2019). To explore this potential problem, the primary data in Table 2 of Trimmels paper was extracted and reanalysed using the R package called “BUGSnet” (Bayesian inference Using Gibbs Sampling to conduct a Network meta-analysis) in R (Béliveau et al., 2019). The initial reanalysis duplicated Trimmels results, as can be seen in the netplot (Figure 1).
Figure 1. Netplot of Trimmel original data.
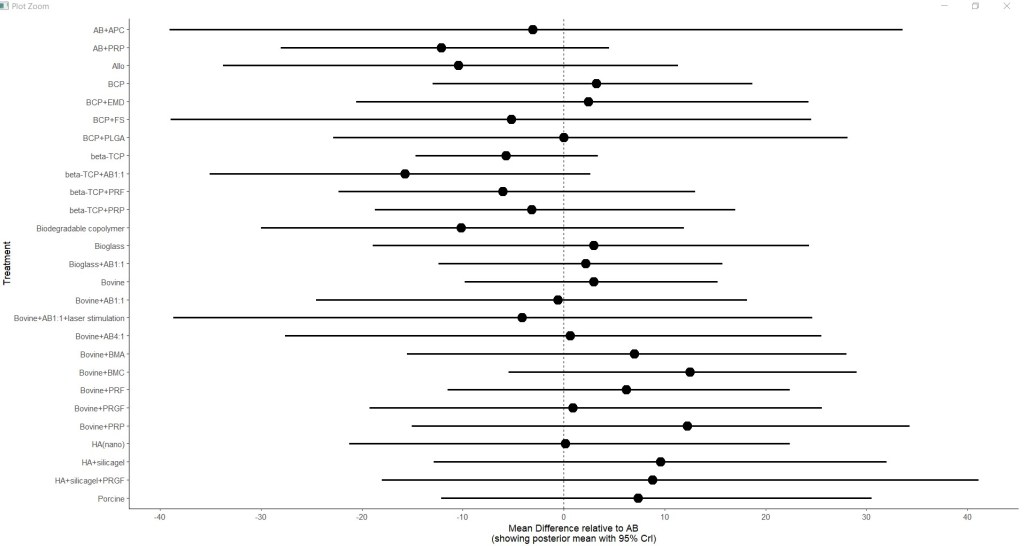
The material and methods section of the original paper mentioned that each intervention would be presented compared to a placebo in a forest plot; however, the forest plot was not shown in the paper. In the reanalysis, the forest plot is given below. It clearly shows the very wide credibility intervals. Almost all the treatment options cross the null effect line, confirming the problems created by incorporating many small poorly networked studies and the resultant indirect estimates the model generates (Figure 2.).
Figure 2. Forest plot relative to autogenous bone
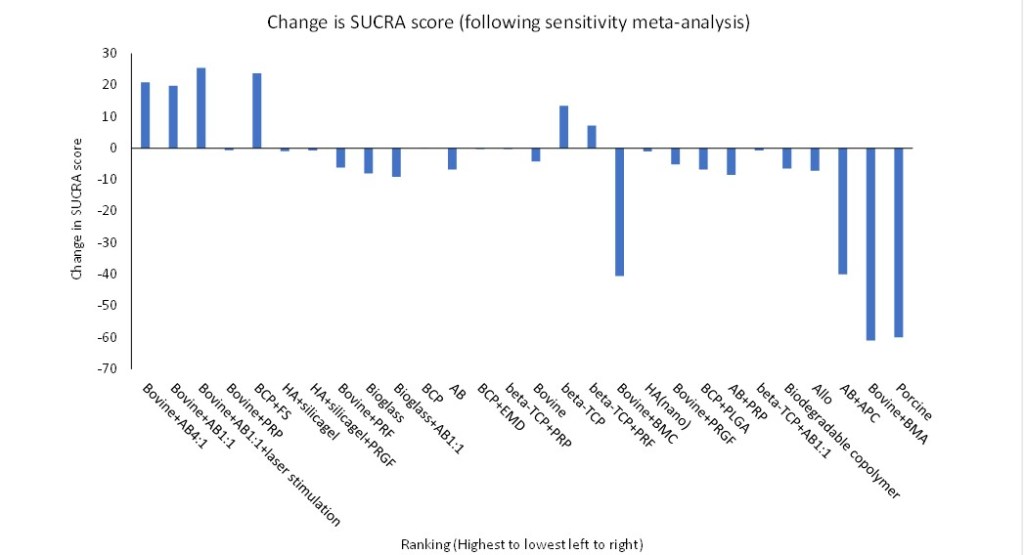
To explore this further, the simplest method was to undertake a sensitivity meta-analysis and remove those studies considered to be at high risk of bias. These studies would be the most likely to result in misleading results (Chaudhry et al., 2015). The 9 papers the authors considered to be a high risk of bias were removed from the NMA database, and 2 further papers that appeared to share a control group. The rankings were then recalculated and presented alongside the original ranking data to observe any changes. The reanalysis removed 3 treatments from the ranking (autogenous bone plus autologous platelet concentrate, bovine plus bone marrow aspirates, and porcine bone), plus bone marrow concentrate was dropped 18 places from 81% to 40%. The top five highest-ranking treatments now include bovine bone mixed with autologous bone, bovine bone plus platelet-rich fibrin (PRF), and biphasic calcium phosphate (HA/β-TCP = 60/40) combined with fibrin sealant (FS). (Table 1.)
Table 1. Change in top 5 ranked augmentation materials.
Rank
Sensitivity meta-analysis
Score
Original meta-analysis
Score
1
Bovine+AB4:1
85
Bovine+BMC
81
2
Bovine+AB1:1
83
Bovine+PRP
77
3
Bovine+AB1:1+laser stimulation
77
Bioglass+AB1:1
70
4
Bovine+PRP
76
HA+silicalgel
70
5
BCP+FS
73
Bioglass
70
We could conclude that the sensitivity analysis confirmed the authors finding that autologous bone did not show superiority to composite grafting material. Significantly, however, the ranking of those materials changes at the extremes, with the first six highest rankings being substantially downgraded and three treatments being removed from the meta-analysis altogether (Figure 3).
Figure 3. Change in SUCRA scores with sensitivity analysis.
In summary, both the researcher and the reader must exercise caution when undertaking a network meta-analysis. Leaving aside the issue of transitivity assumptions, consistency and statistical complexity, network analysis will not eliminate the problems associated with combining multiple small, severely underpowered studies that could be potentially at high risk of bias. To quote Foote and co-authors: –
Assessing the credibility of the methodology is an important first step in critically appraising an NMA. As with conventional systematic reviews, assessing credibility involves evaluating the article for a sensible research question, an exhaustive search, reproducible selection and assessment of articles, presenting clinically relevant results, and addressing certainty in effect estimates (Foote et al., 2015).
It is true to say that our judgement is not always at it’s best when we are stressed or under time pressure. In a recent paper (Plessas et al., 2019 ) a research team placed 40 dentist under time pressure to assess a number of dental radiographs and compared it to the same groups results if they has as much time as they felt necessary. Their conclusion was:
Time pressure negatively impacts one aspect of dentists’ diagnostic performance, namely sensitivity (increased diagnostic errors and omissions of pathology), which can potentially affect patient safety and the quality of care delivered.
Since this study was based about diagnostic test accuracy (DTA) I felt it might be interesting to express this result graphically, and the author was kind enough to provide me with the raw data from the research. The data was extracted into excel and then analysed using the statistical package ‘mada’ in R to create a summary receiver operator characteristic (sROC).
The Results
The ellipse with circle surrounded by the solid line represents the summary estimate for diagnosis with time pressure (TP) and 95% confidence interval, and the ellipse with triangle surrounded by the dotted line represents the summary estimate for diagnosis with no time pressure (NTP).
Time pressure
Sensitivity = 0.551 (95%CI: 0.439 to 0.658)
False positive rate = 0.006 (95%CI: 0.004 to 0.01)
No time pressure
Sensitivity = 0.797 (95% CI: 0.692 to 0.873)
False positive rate = 0.009 (95%CI: 0.006 to 0.13)
Summary result
The difference between TP and NTP are statistically significant p=0.0007
In absolute terms there was a 24.6% reduction in correct diagnosis under TP.
In relative terms there was a 40% reduction in correct diagnosis under TP.
My conclusion
When under stress or significant time pressure there was a significant reduction in the clinician ability to diagnose pathology (from 80% to 55%) but a misdiagnosis of ‘normal’ was very low in both scenarios.
Acknowledgements
I would like to thank the authors for allowing me access to their data
Plessas, A., Nasser, M., Hanoch, Y., O’Brien, T., Bernardes Delgado, M. and Moles, D. (2019) ‘Impact of time pressure on dentists’ diagnostic performance’, Journal of Dentistry, 82, pp. 38–44. doi: 10.1016/j.jdent.2019.01.011.

 Time pressure