Question:
How much additional protection does a Class 3 filtering facepiece (FFP) mask offer over an FFP2 mask or a standard fluid resistant surgical facemask (Type IIR) when worn during aerosol generating procedures (AGPs) in dentistry?
Bottom-line answer:
From the evidence presented below there would appear to be small additional protection (0.4%) offered by and FFP3/FFP2 masks compared to a surgical facemask during aerosol generating procedures in the dental environment if high volume suction and rubber dam are used in combination. In the absence of rubber dam this difference increases to 7%.
Background
Much of the UK emergency planning regarding Covid-19 stems from protocols following the Severe Acute Respiratory Syndrome (SARS) epidemic of 2003. In terms of dentistry our current measures were outlined in a paper by Li and co-workers (Li et al., 2004). The major difference between the planning for SARS/MERS and Covid-19 is that both the preceding respiratory viruses were considerably more dangerous with a cumulative fatality rate (CFR) of 11% and 34% respectively, whereas estimates to date suggest a CFR for Covid-19 <1% (Park et al., 2020; Rajgor et al., 2020; Bendavid et al., 2020).
The Public Health England guidance document for personal protective equipment updated 27 April 2020 (GOV.UK, 2020) states the need to limit the use of fluid resistant surgical facemasks (FRSM) to non-AGP procedures, and FFP2/FFP3 for aerosol generating procedures (AGPs) procedures. This guidance is general, and not specific to dental AGPs. In order to assess how effective the use of these masks in the dental environment is when an AGP is created we need to go to a review by Harrel and co-workers post SARS (Harrel and Molinari, 2004) who cited 5 main categories of AGP:
- Ultrasonic and sonic scalers
- Air polishing
- Air-water syringes
- Tooth preparation with a high/slow speed handpiece
- Tooth preparation with air abrasion
Besides good cross infection policy the three papers (Harrel and Molinari, 2004; Li et al., 2004; Kohn et al., 2003) published just after SARS all mention three methods to reduce AGPs; appropriate PPE, rubber dam isolation and high volume suction equipment, which is common to all dental surgeries.
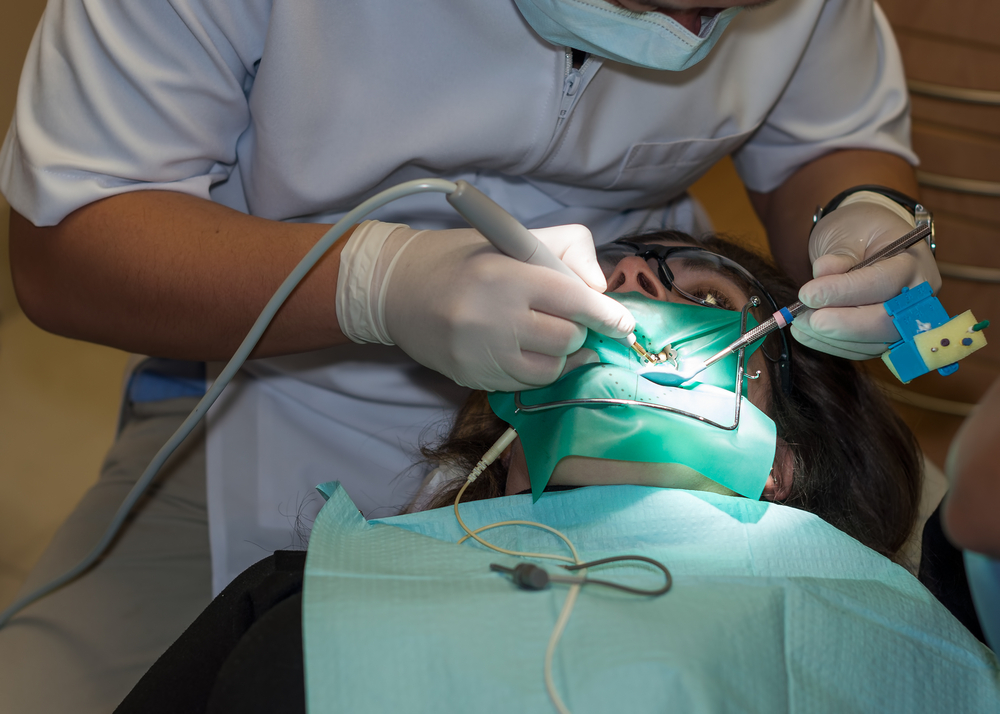
Rubber dam has been in use since 1864 and is used to isolate one or more teeth from the fluids in the oral environment using a thin sheet of latex or silicon rubber. High volume suction draws a large volume of air away from the oral cavity during operative procedure also reducing the amount of aerosol and splatter.
Method
To see how effective these three pieces of equipment a rapid review of high-volume aspiration and rubber dam was undertaken. A recent systematic review, and rapid review of surgical masks versus FFP3 masks had already concluded finding no statistical difference in effectiveness between the masks regarding influenza like viral infections (Long et al., 2020; Greenhalgh et al., 2020). The filtration capacity of a standard surgical face mask is highly variable compared to an FFP2 or FFP3 mask, Oberg and co-workers (Oberg and Brosseau, 2008) concluded that none of the surgical masks tested in-vivo on 40 subjects exhibited adequate filter performance and facial fit characteristics to be considered respiratory protection devices. The mean penetration by 0.8μm latex spheres was 37.89 (95% CI: 25.8% to 50.0%) for the dental quality masks in their study (A,B,C, and E).
For the rapid review observational studies comparing the effect on aerosol and bioaerosol contamination form the use of high-volume aspiration and/or rubber dam compared with dental treatment without these procedures in place were identified. There was no language or date restriction. Ovid (Medline), Scopus (Elsevier) and the Cochrane databases were searched (See Appendix).
Seven studies fulfilled the inclusion criteria. 3 studies related to high volume suction (Harrel et al., 1996; Jacks, 2002; Devker et al., 2012), and 4 related to the use of rubber dam (Cochran et al., 1989; Samaranayake et al., 1989; Dahlke et al., 2012; Al-Amad et al., 2017). The studies were all moderate to low quality. There was insufficient data for meta-analysis.
Summary of findings
High volume suction
Regarding the use of high volume suction Harrel and co-workers (Harrel et al., 1996) undertook an in vitro study using an ultrasonic scaler for 1 minute to generate a dye containing aerosol, the experiment was repeated 10 times. The high-volume evacuator attachment produced a 93% reduction in surface contamination . Jacks performed a similar in-vitro study resulting in a 90.8% reduction in surface contamination (Jacks, 2002). The only in-vivo study was by Devker and co-workers (Devker et al., 2012), 30 dentate subjects had half their mouths cleaned using an ultrasonic scaler as a control and the other half using high volume suction. 4 culture plates were placed on the operator and patient resulting in an 81% reduction in bacterial culture forming units.
Rubber dam placement
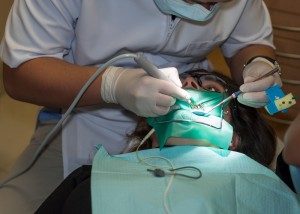
The second part of the review related to rubber dam usage. In Cochran’s study (Cochran et al., 1989) microbial collection was performed during preparation and placement of amalgam and composite resin restorations with and without the rubber dam resulting in a 90% to 98% reduction in microorganisms. Samaranayake (Samaranayake et al., 1989) undertook an in-vivo study with 10 child patients in each arm. The control group had their conservative dentistry with high volume suction only and the experimental group had high volume suction with rubber dam isolation. The mean reduction in culture forming units at 1 meter was 87.9% ±10.3 with the rubber dam . Dahlke conducted an in-vitro study using dye, rubber dam and high-volume suction while preparing the surface of a typodont tooth with a dental handpiece. The experiment was repeated 24 times resulting in a 33% reduction in surface contamination. The final study involved 52 senior dental students performing restorative dental treatment with and without a rubber dam (Al-Amad et al., 2017) and produced a strange outlier results with an increased level of contamination, which may highlight technique sensitivity. The lack of papers is possibly a function of the large effect sizes produced in the earlier studies reducing the demand for duplication.
Putting the three components into a clinical workflow
There are three components here:
- High-volume suction reduces bioaerosols by about 81% to 90%
- Rubber dam reduces bioaerosols by a further 30% to 90%
- Fluid resistant surgical facemask filter 62% airborne particles
- FFP2 masks filter 94% airborne particles
- FFP3 masks filter 99% of airborne particles
Putting these components together in a clinical environment, a well-trained dental team using high-volume aspiration and rubber dam could reduce the bioaerosol by about 99%. If we take the efficacy of the masks as stated in government guidance and apply it to this reduction, we get an overall reduction in AGPs of 99.62% for the surgical mask, 99.94% for FFP2 masks and 99.99 for FFP3 respectively, with a risk difference (RD) of 0.37% between the surgical mask and FFP3 and a relative risk of 0.996 (See Table 1). With the lower suction efficiency of 81% without the use of rubber dam this difference would change to 7.03% RD and RR of 0.929. There was insufficient data to produce confidence intervals.
Table 1. Differences in face mask effectiveness in dental AGP
| Mask Type |
Filtration (%) |
HVS* only (%) |
HVA+ RD (%) |
RDiff (%) |
RR |
| Surgical mask |
62 |
92.78 |
99.62 |
6.84 |
0.931 |
| FFP2 |
94 |
98.86 |
99.94 |
1.08 |
0.989 |
| FFP3 |
99 |
99.81 |
99.99 |
0.18 |
0.998 |
| HVA- High volume suction RD – Rubber Dam RDiff – Risk difference RR – Relative risk |
Conclusion
In the clinical environment where high volume aspiration and rubber dam is in use during dental AGP procedures there may be no significant additional benefit in wearing an FFP3/FFP2 or surgical mask. There is a much larger difference if the quality of the HVS is reduced and rubber dam is not used It may be that the moderate benefit of FFP2 and FFP3 masks is lost over time due to functional factors such as movement of the mask or cross contamination from extended wear compared to changing masks between patients (Greenhalgh et al., 2020). Where supply of FFP3 masks might limit the delivery of primary dental care we will need to consider if the additional benefit is outweighed by the harms of delaying or restricting care to asymptomatic and healthy patients. These results are hypothetical and due to the lack of specific studies of virus penetration of facemasks in dentistry are based on surrogate, and composite outcomes. There is an urgent need for specific studies to address mask performance in the dental surgery environment.
Disclaimer: The article has not been peer-reviewed; it should not replace individual clinical judgement, and the sources cited should be checked. The views expressed in this commentary represent the views of the author and not necessarily those of the host institution. The views are not a substitute for professional advice.
References
AL-AMAD, S. H., AWAD, M. A., EDHER, F. M., SHAHRAMIAN, K. & OMRAN, T. A. 2017. The effect of rubber dam on atmospheric bacterial aerosols during restorative dentistry. Journal of infection and public health, 10, 195-200.
BENDAVID, E., MULANEY, B., SOOD, N., SHAH, S., LING, E., BROMLEY-DULFANO, R., LAI, C., WEISSBERG, Z., SAAVEDRA, R. & TEDROW, J. 2020. COVID-19 Antibody Seroprevalence in Santa Clara County, California. medRxiv.
COCHRAN, M. A., MILLER, C. H. & SHELDRAKE, M. A. 1989. The efficacy of the rubber dam as a barrier to the spread of microorganisms during dental treatment. The Journal of the American Dental Association, 119, 141-144.
DAHLKE, W. O., COTTAM, M. R., HERRING, M. C., LEAVITT, J. M., DITMYER, M. M. & WALKER, R. S. 2012. Evaluation of the spatter-reduction effectiveness of two dry-field isolation techniques. J Am Dent Assoc, 143, 1199-204.
DEVKER, N. R., MOHITEY, J., VIBHUTE, A., CHOUHAN, V. S., CHAVAN, P., MALAGI, S. & JOSEPH, R. 2012. A study to evaluate and compare the efficacy of preprocedural mouthrinsing and high volume evacuator attachment alone and in combination in reducing the amount of viable aerosols produced during ultrasonic scaling procedure. The journal of contemporary dental practice, 13, 681-9.
GOV.UK. 2020. COVID-19 ( personal protective equipment (PPE) [Online]. Available: https://www.gov.uk/government/publications/wuhan-novel-coronavirus-infection-prevention-and-control/covid-19-personal-protective-equipment-ppe [Accessed 29th April 2020].
GREENHALGH, T., CHAN, X. H., KHUNTI, K., DURAND-MOREAU, Q., STRAUBE, S., DEVANE, D., TOOMEY, E., IRELAND, E. S. & IRELAND, C. 2020. What is the efficacy of standard face masks compared to respirator masks in preventing COVID-type respiratory illnesses in primary care staff?[Internet]. Oxford, UK: Oxford COVID-19 Evidence Service.
HARREL, S. K., BARNES, J. B. & RIVERA-HIDALGO, F. 1996. Reduction of aerosols produced by ultrasonic scalers. Journal of periodontology, 67, 28-32.
HARREL, S. K. & MOLINARI, J. 2004. Aerosols and splatter in dentistry: a brief review of the literature and infection control implications. The Journal of the American Dental Association, 135, 429-437.
JACKS, M. E. 2002. A laboratory comparison of evacuation devices on aerosol reduction. Journal of dental hygiene: JDH, 76, 202-206.
KOHN, W. G., COLLINS, A. S., CLEVELAND, J. L., HARTE, J. A., EKLUND, K. J. & MALVITZ, D. M. 2003. Guidelines for infection control in dental health-care settings-2003.
LI, R., LEUNG, K., SUN, F. & SAMARANAYAKE, L. 2004. Severe acute respiratory syndrome (SARS) and the GDP. Part II: Implications for GDPs. British dental journal, 197, 130-134.
LONG, Y., HU, T., LIU, L., CHEN, R., GUO, Q., YANG, L., CHENG, Y., HUANG, J. & DU, L. 2020. Effectiveness of N95 respirators versus surgical masks against influenza: A systematic review and meta-analysis. J Evid Based Med.
OBERG, T. & BROSSEAU, L. M. 2008. Surgical mask filter and fit performance. Am J Infect Control, 36, 276-82.
PARK, M., THWAITES, R. S. & OPENSHAW, P. J. 2020. COVID‐19: Lessons from SARS and MERS. European Journal of Immunology, 50, 308.
RAJGOR, D. D., LEE, M. H., ARCHULETA, S., BAGDASARIAN, N. & QUEK, S. C. 2020. The many estimates of the COVID-19 case fatality rate. The Lancet Infectious Diseases.
SAMARANAYAKE, L., REID, J. & EVANS, D. 1989. The efficacy of rubber dam isolation in reducing atmospheric bacterial contamination. ASDC journal of dentistry for children, 56, 442-444.
Appendix
Search strategy Ovid Medline
| 1 |
exp *dentistry/ or exp *dental care/ |
291029 |
| 2 |
(dental or dentistry).m_titl. |
141221 |
| 3 |
(high volume suction or high-volume aspiration).af. |
18 |
| 4 |
1 or 2 or 3 |
371934 |
| 5 |
*Aerosols/ |
8879 |
| 6 |
(aerosol* or bioaerosol* or bio-aerosols*).m_titl. |
18171 |
| 7 |
5 or 6 |
20618 |
| 8 |
4 and 7 |
146 |
| 9 |
aspiration.mp. |
82401 |
| 10 |
7 and 9 |
54 |
| 11 |
Suction/ |
12363 |
| 12 |
3 or 9 or 11 |
90954 |
| 13 |
8 and 12 |
12 |
| 14 |
Rubber Dams/ |
498 |
| 15 |
rubber dam*.mp. |
1124 |
| 16 |
8 and 15 |
7 |
Other References
Dental Elf Blog – 25th Mar 2020