‘Youth and adolescence are crucial time periods for psychosocial development and educational attainment as a healthy adolescence paves the way for a healthy and productive adulthood. This period is also critical for the onset of common mental disorders, especially in educational settings such as professional colleges and universities’ (Akhtar et al., 2020).
In a recent systematic review analysing the global age of onset of mental disorders by Solmi and co-workers, the peak age of onset for depressive disorders was 20.5 years. Interestingly, the proportion onset by the age of 18 was 13.2%, increasing almost threefold to 36.9% by 25 years. This figure conflicts with the statement in Akhtar’s paper ‘that university students report higher rates of depression than the general population with prevalence estimates ranging from 24% to 34%’. The student population estimate is most likely confounded by variations in the classifications used for the ‘population’ and the tools used to measure mental health globally (Solmi et al., 2021; Akhtar et al., 2020).
Two separate systematic reviews were published in 2021 concerning the prevalence of depression in the dental student population. The first paper by Muniz and co-workers investigated depression before the COVID-19 pandemic (before Jan 2020). The second paper by Santabarbara set out to investigate the impact of altered teaching methods and clinical practice on the prevalence of depression in dental students during the COVID-19 pandemic (after December 2019) (Muniz et al., 2021; Santabarbara et al., 2021). These papers have been reviewed below.
Neither review registered a research protocol, but both followed the Preferred Reporting Items for Systematic Reviews and Meta-analysis (PRISMA)(Moher et al., 2009).
Paper 1: Muniz et al.(2021)
Methodology
The two research questions for Muniz and co-workers were:
- What is the prevalence of self-reported depressive symptoms in dental students?
- Are sex and enrolment years of study associated with self-reported depressive symptoms in dental students?
A systematic search for observational studies (both undergraduate and postgraduate students) was performed in the MEDLINE (via PubMed), Scopus, Web of Science and Embase electronic databases with records published up to January 7, 2020. Gray literature was searched for in Google Scholar. The risk of bias was assessed using the Agency for Healthcare Research and Quality (AHRQ) scale for cross-sectional studies and the Newcastle-Ottawa scale (NOS) for cohort studies. Standard mean differences (SMD) and pooled odds ratios (OR) were calculated for the questionnaires scores and self-reported depressive symptoms.
Results
- 58 studies were fulfilled the inclusion criteria, of which only 9 were cohort studies.
- 15 different measurement tools were used. The 2 most frequently used tools were the: Beck Depression Inventory (19/58) and the Depression Anxiety Stress Scale (DASS) (19/58).
| Prevalence of Self-reported depressive symptoms | |
| Range | 2.75% to 89.84% |
| Pooled estimate (95% confidence interval) | 29% (95%CI: 26% to 34%) |
| Comparison between sex for the mean questionnaires scores (male: female) | |
| Standard mean differences (SMD) | -0.22 (95%CI: -0.42 to -0.03) p=0.03 |
| Comparison between years of educational training in dental students | |
| Odds ratio (OR) | 1.00 (95%CI: 0.73 to 1.35) p=0.99 |
Conclusions:
The authors concluded: –
It was concluded that the prevalence of self-reported depressive symptoms varied significantly in the literature and that female dental students presented a higher chance of depressive symptoms. However, no difference was detected between the different years of dental educational training.
Paper 2. Santabarbara et al.(2021)
Methodology
The main objective of this study was to investigate the prevalence of depression in dental students during the COVID-19 pandemic and whether gender, age or the country had a significant effect on the prevalence of depression.
A systematic search for suitable cross-sectional studies was performed in the MEDLINE (via PubMed), Embase, and Scielo electronic databases with records published up to October 1, 2019. Grey literature was searched for through medRxiv and Google Scholar. The risk of bias was assessed using the Joanna Briggs Institute (JBI) standardised critical appraisal instrument for prevalence studies.
Results
- 13 studies fulfilled the inclusion criteria. Most of the studies were conducted in the Middle East (n=6), Asia (n=4), the Americas (n=2) and Europe (n=1).
- The most common assessment tools were the Depression, Anxiety and Stress Scale (n = 10) and the Patient Health (n = 2), with one study used the Hospital Anxiety and Depression Scale.
- The estimated overall prevalence of depression in dental students was 37% (95% CI: 26 to 49%), with significant heterogeneity between studies (Q test: p < 0.001; I2 = 98.3%)
- The meta-regression analysis showed that the prevalence rate of depression was independent of the percentage of women (p = 0.815), mean age at baseline (p = 0.407), response rate (p = 0.727) or methodological quality (p = 0.847).
- There was a higher prevalence of depression for studies conducted in Asia (40% (95% CI: 27 to 53%)) compared to those from Europe or America (29% (95% CI: 16 to 45%)).
Conclusions:
The authors concluded: –
Our results suggest that dental students are suffering from higher levels of depression compared with the general population or other college students during the COVID-19 pandemic, with differences across regions. Measures to improve the mental health and wellbeing of dental students during the pandemic are needed.
Comments
Taking both these systematic reviews at face value, it would be reasonable to assume that there had been a significant increase in mental health issues and depression in dental students during the pandemic (Mean Difference=8% (95%CI 7.9% to 8.1%), p<0.0001). However, the results of both these reviews need to be interpreted with a high degree of caution and are not generalisable for several reasons.
It should be noted that both papers include a wide range of different mental health assessment tools in their meta-analysis. Combining various assessment tools will negatively impact the accuracy and precision of any meta-analysis by increasing the heterogeneity. To reduce this heterogeneity problem, it would be tidier to compare like with like, and in this case both reviews have 10+ studies utilising the DASS assessment tool. Below is the forest plot of a sensitivity meta-analysis comparing the pre-pandemic DASS scores with those during the pandemic. The meta-analysis was conducted using ‘metaprop’ in R and a Freeman Tukey double arcsine transformation similar to the Santabarbara review.
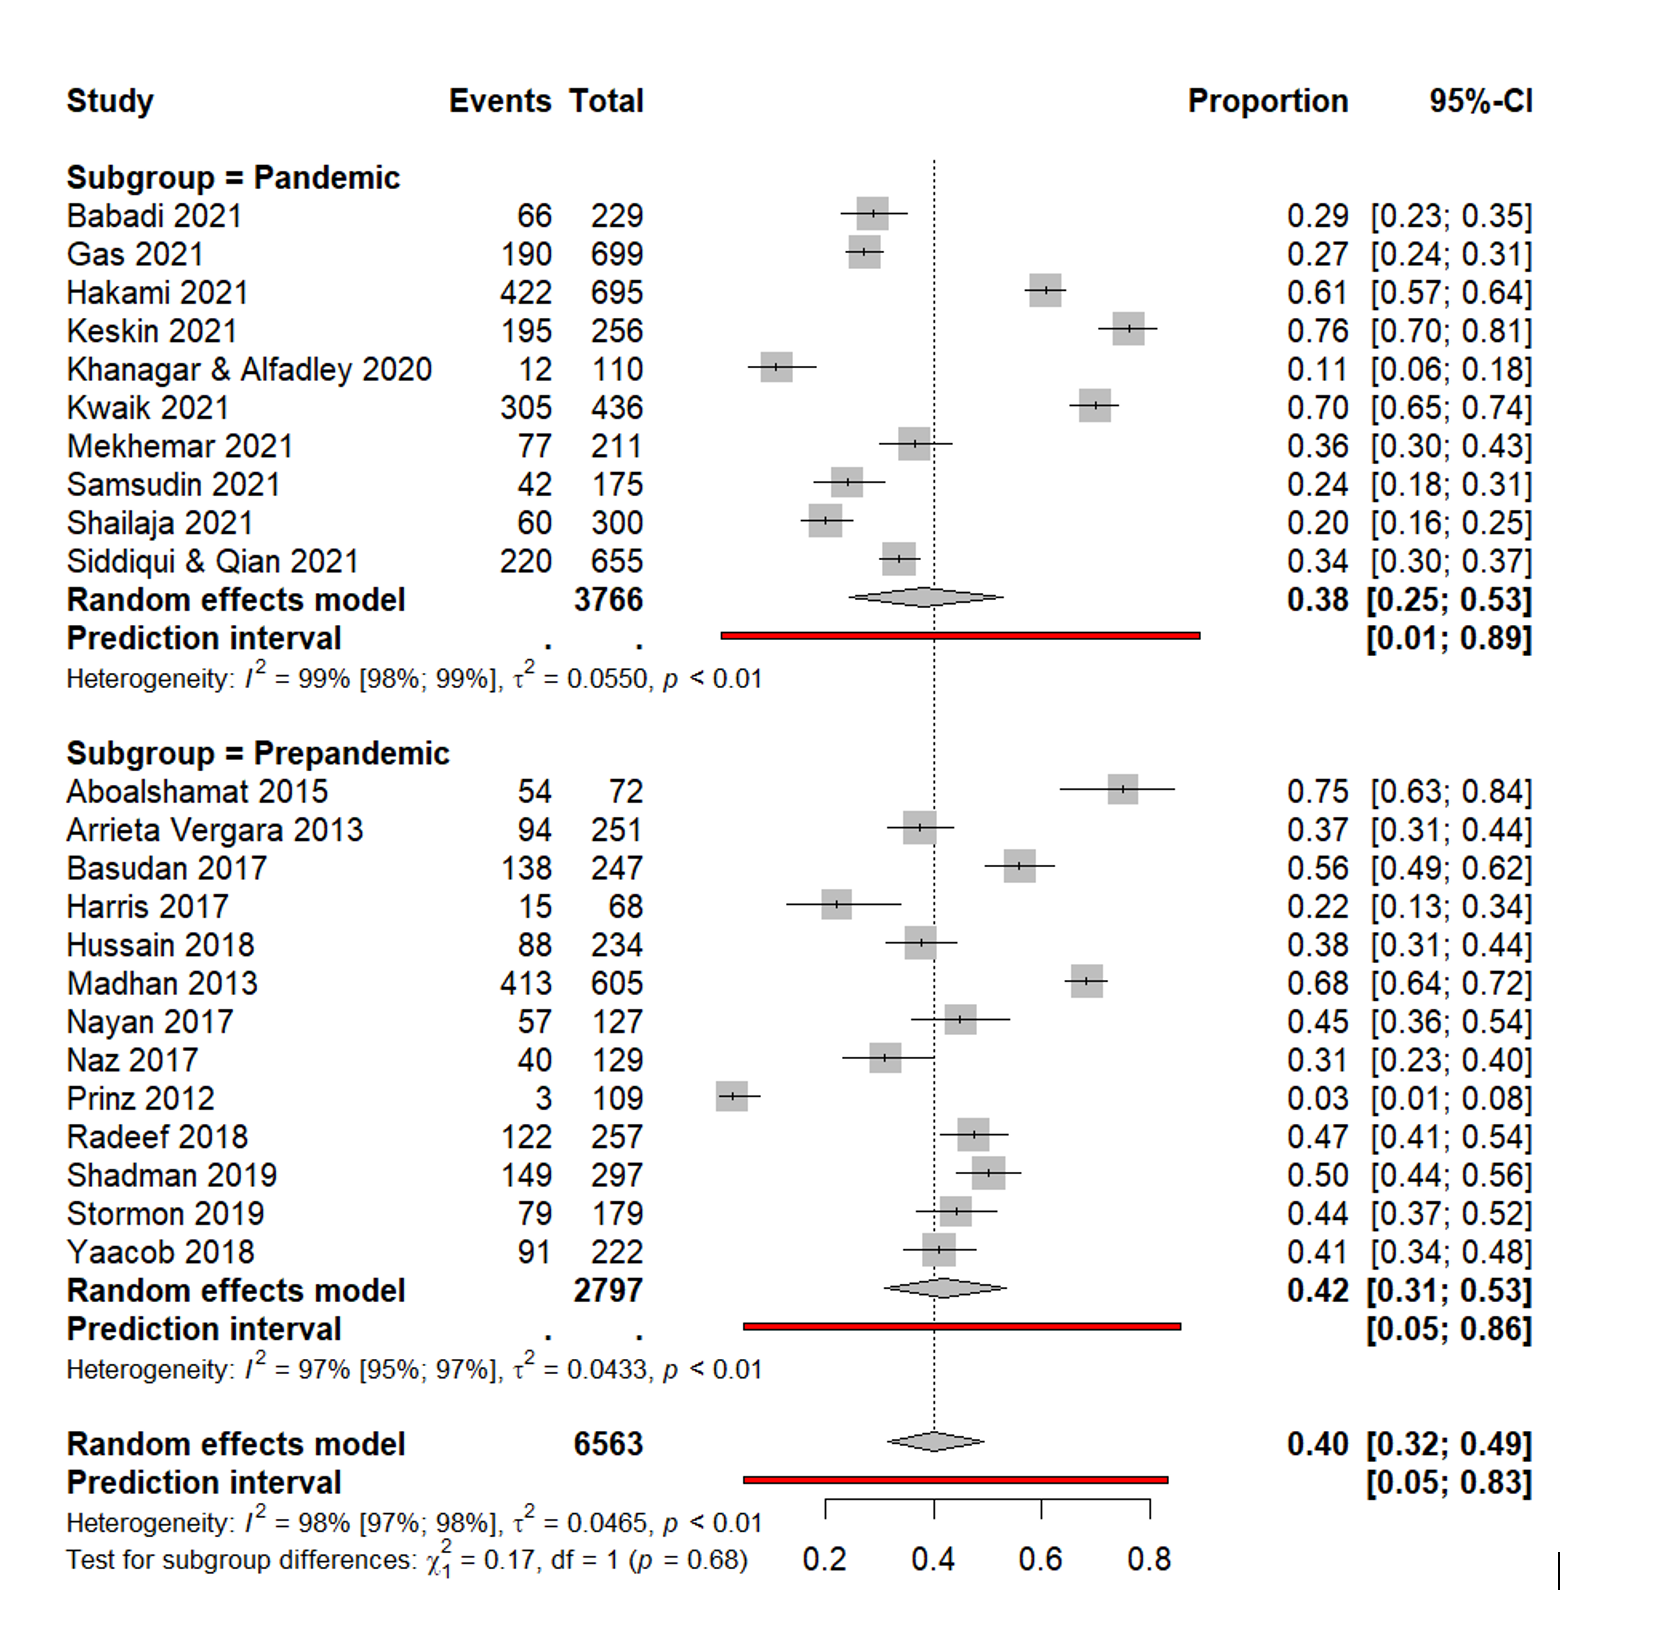
By comparing the prepandemic and pandemic groups that use only the DASS there is no significant difference in the prevalence levels (p=0.68).
| Comparative analysis of original results and sensitivity analysis | |
| Original summary estimate | Sensitivity meta-analysis (DASS only studies) |
| Prepandemic | |
| 29% (95%CI: 26% to 34%) | 42% (95%CI: 31% to 53%) |
| During the pandemic | |
| 37% (95%CI: 26% to 49%) | 38% (95%CI: 25% to 53%) |
The heterogeneity is extremely high with I2 values of 97% to 99%, which leads to prediction intervals that almost span the full range of values, so the true value of a future study could be anywhere between 1% and 89%.
There are a few more interesting points to consider from the sensitivity analysis
| Geographical location and percentage of female students in the sensitivity meta-analysis | ||
| Muniz et al. 2021(N=13) | Santabarbara et al 2021 (N=10) | |
| Asia | 6 | 3 |
| Middle East | 3 | 6 |
| Europe | 2 | 1 |
| South America | 1 | 0 |
| Oceania | 1 | 0 |
| Percentage female students | 68% | 62% |
Firstly both subgroups were heavily biased toward Middle Eastern and Asian countries, so these results aren’t generalisable to Europe, North America or Australia. In the prepandemic study, Muniz found that female dental students presented a higher chance of depressive symptoms, and Santabarbara did not see any difference in the pandemic studies. If we take the sensitivity meta-analysis of ‘no difference’ as a more accurate assessment of the prevalence of depressive symptoms and have relatively balanced populations regarding geographical location and sex, what can we conclude? Firstly, generally speaking, dental students are at a higher risk of depressive symptoms than the general student population. Secondly, dental students are no more depressed than before the pandemic, but the stressors present before the pandemic have changed (remote learning, PPE and reduced clinical time) and are less sensitive to the student’s sex/gender.
Age at onset of mental disorders: global meta-analysis provides data for targeting effective interventions
References
Akhtar, P., Ma, L., Waqas, A., et al. 2020. Prevalence of Depression among University Students in Low and Middle Income Countries (Lmics): A Systematic Review and Meta-Analysis. Journal of Affective Disorders, 274, 911-919.
Moher, D., Liberati, A., Tetzlaff, J., et al. 2009. Preferred Reporting Items for Systematic Reviews and Meta-Analyses: The Prisma Statement. PLoS Medicine, 6, e1000097.
Muniz, F., Maurique, L. S., Toniazzo, M. P., et al. 2021. Self-Reported Depressive Symptoms in Dental Students: Systematic Review with Meta-Analysis. J Dent Educ, 85, 135-147.
Santabarbara, J., Ozamiz-Etxebarria, N., Idoiaga, N., et al. 2021. Meta-Analysis of Prevalence of Depression in Dental Students During Covid-19 Pandemic. Medicina (Kaunas), 57.
Solmi, M., Radua, J., Olivola, M., et al. 2021. Age at Onset of Mental Disorders Worldwide: Large-Scale Meta-Analysis Of 192 Epidemiological Studies. Molecular Psychiatry.
| Mental Health Questionnaire | Number (N=58) |
| Beck Depression Inventory (BDI) | 19 |
| Depression Anxiety Stress Scale (DASS) | 19 |
| Hospital Anxiety and Depression Scale (HADS) | 4 |
| Zung Depressive Scale | 3 |
| Goldberg Anxiety and Depression Scale | 1 |
| Hamilton Depression Rating Scale (HDRS) | 1 |
| Kutcher Adolescent Depression Scale | 1 |
| Patient Health Questionnaire (PHQ) | 4 |
| Aga Khan University Anxiety and Depression Scale | 1 |
| Center for Epidemiological Studies-Depression | 1 |
| General Health Questionnaire | 1 |
| Mental Health Inventory, | 1 |
| Hopkins Symptom Checklist | 1 |
| Symptom Questionnaire | 1 |