Please may I take your temperature. Screening for Covid-19?

smurf

Bottom line

Even though handheld infrared thermometers are convenient to use to check if a patient has an elevated body temperature, they aren’t sufficiently accurate for screening purposes. Using recent Office of National Statistics data on the prevalence of Covid-19 in the population the false positive rate is too high (>95%). The major confounders regarding accuracy are environmental temperature, humidity, gender, exercise, and age.

Background

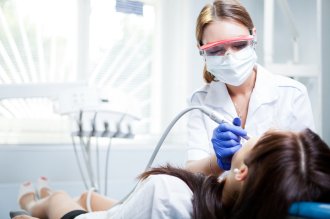
In the recent Cochrane ‘Recommendations for the re-opening of dental services: a rapid review of international sources’(Cochrane, 2020) some of the guidelines recommended temperature screening of the patients at reception for elevated body temperature. The rational being that if a patient is infected with Covid -19 the body’s response to the virus often results in core body temperature increase. Traditionally body temperature was taken with a glass/mercury or electronic thermometer that required intimate contact with the patient but now there are handheld infrared thermometers (HIRT) that are quick and require only skin contact via the ear canal, or contactless by measuring the forehead skin temperature. In this opinion paper we aim to find out how effective temperature screening is in detecting Covid infected patients.

Methods

To reduced unnecessary searching through the literature to answer this question the diagnostic accuracy data was extracted from two rapid reviews, the most recent from the Emergency Care Research Institute (ECRI, 2020), and the second from the Canadian Agency for Drugs and Technologies in Health (CADTH, 2014). It was possible to extract the sensitivity and specificity data for 10 studies measuring the effectiveness of HIRT for forehead temperature (FT), and 7 studies measuring ear (tympanic) temperature (TT). The data was extracted and back transformed into a classic 2×2 table giving us the true positive (TP), false negative (FN), false positive (FP) and true negative (TN) data and meta-analysis was carried out using the ‘mada’ package in R. The summary estimate for sensitivity and specificity for TT and FT are tabulated below (See Table 1).

Table 1. Summary estimates for IR thermometer

Measurement location Sensitivity Specificity
Tympanic temperature 78.7 (95% CI: 69.4 to 85.8) 91.8 (95% CI: 75.7 to 97.6)
Forehead temperature 51.1 (95% CI: 19.3 to 82.0) 97.1 (95% CI: 92.2 to 99.0)

The results for the TT and TF results were plotted together on to a Summary Receiver Operating Characteristic (sROC) curve for comparison. The y-axis represents the sensitivity (1.0 =100%), and the x-axis represents 1- specificity (0.1 = 10%), the solid triangle and circle are the summary estimates, and the ellipses are the 95% confidence areas. ( Figure 1.)

Figure 1. Comparison of diagnostic accuracy tests

ROCtemp

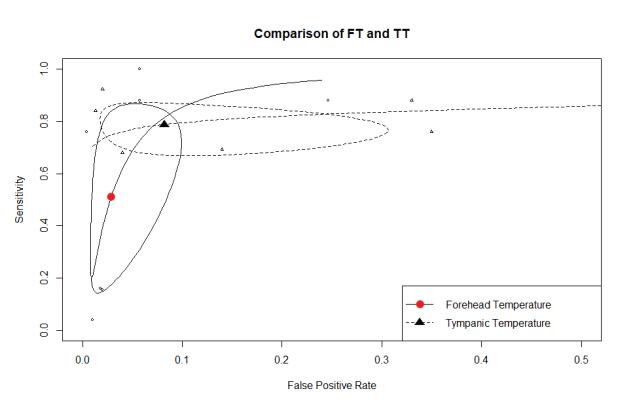
A perfect diagnostic test would be in the extreme top left corner representing 100% true positives and 0% false positives and from the chart we can see that point is outside the 95% confidence area meaning that both tests are poor for screening. To clarify this point I transformed the sensitivity/specificity results into a frequency tree (Figure 2) using a diagnostic test calculator (http://araw.mede.uic.edu/cgi-bin/testcalc.pl)

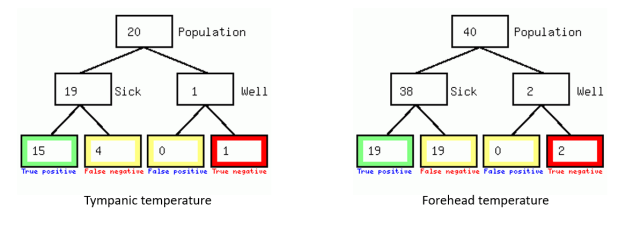
 Figure 2. Frequency trees for diagnostic tests for screening Covid-19 (Prevalence 1:400)

Frequency tree

If these thermometers are used for screening patient for Covid infection then out of every  838 patients who test positive with elevated TT only 20 will be infected which corresponds to a probability of 2.4% and for the FT that rises to 4.2%.

What happens if we use these thermometers to confirm a diagnosis of fever where we set a prevalence of 95% instead of 0.0025% (Figure 3.).

Figure 3. Frequency trees for diagnostic tests to confirm fever

Frequency tree_v1

Conclusions  The authors of the  recent ECRI report concluded:-

Temperature screening programs using IR alone or with a questionnaire for mass screening are ineffective for detecting infected persons, based on our review of evidence from 2 large systematic reviews (SRs), 3 simulation studies, and 6 diagnostic cohort studies (not included in the SRs). Under best-case scenarios, simulation studies suggest such screening will miss more than half of infected individuals. They are ineffective for mass screening because of the low number of infected individuals who have fever at the time of screening and inconsistent technique by operators.

Comments

Both pieces of diagnostic equipment produce highly variable results whether used for screening or confirming a diagnosis of febrile illness. The limitations are well described in the CADTH report (CADTH, 2014):

The retrieved studies have mentioned potential confounders for measure of temperature such as sweat, gender, age, the range of temperature, the rater, physical activity, the use of antipyretic drugs and emotional state. These factors are even more susceptible to vary in a real world conditions than in a clinical study setting. Moreover, the different brand/model/mode of devices used make it difficult to draw general conclusions on a class of thermometers. Also, a fair number of pediatric studies were included in the present review, limiting the extrapolation of their results to a general population.

In conclusion if a patients temperature needs to be taken then tympanic temperature is more reliable than forehead temperature, however its use for screening in the practice creates another layer of complexity in the cross infect/record keeping process with little diagnostic value.

Disclaimer:  The article has not been peer-reviewed; it should not replace individual clinical judgement, and the sources cited should be checked. The views expressed in this commentary represent the views of the author and not necessarily those of the host institution. The views are not a substitute for professional advice.


CADTH. 2014. Non-Contact Thermometers for Detecting Fever: A Review of Clinical Effectiveness [Online]. Available: https://www.cadth.ca/infrared-thermometers-detecting-fever-clinical-effectiveness [Accessed].

COCHRANE. 2020. Recommendations for the re-opening of dental services: a rapid review of international sources [Online]. Available: https://oralhealth.cochrane.org/news/recommendations-re-opening-dental-services-rapid-review-international-sources [Accessed].

ECRI. 2020. Infrared Temperature Screening to Identify Potentially Infected Staff or Visitors Presenting to Healthcare Facilities during Infectious Disease Outbreaks [Online]. Available: https://www.ecri.org/covid-webinar-infrared-temperature-screening-reduce-infection-transmission/ [Accessed].

Disclaimer:  The article has not been peer-reviewed; it should not replace individual clinical judgement, and the sources cited should be checked. The views expressed in this commentary represent the views of the author and not necessarily those of the host institution. The views are not a substitute for professional advice.


Are we sleepwalking into PPE paralysis?

“When the facts change, I change my mind. What do you do, Sir?” – John Maynard Keynes

sleepwalkers-figure-roof-sky-royalty-free-thumbnail

Link to Dental Elf

Bottom line answer

As we approach a return to clinical practice policy makers need to be mindful that the dental profession is already highly proficient in cross infection control, and the benefits of new elaborate PPE protocols regarding aerosol generating procedures may be marginal in the light of low disease prevalence. If we need 300,000 participants in a  study it may be impossible to practically demonstrate  significant benefits to patient safety from the perfect PPE model compared to the harms created by expense and access.


Background

The most important element of Keynes’s famous quote relating to the current coronavirus pandemic is the word ‘fact’. Facts at this moment in time are constantly changing as this disease spreads, and what was true two weeks ago is now a distant memory. One major problem we face as far as healthcare policy is concerned is a lack of accurate base-rate data on the prevalence of the disease in the population, this was initially addresses by Professor Ioannidis (Ioannidis, 2020). His article in STAT caused quite a lot of online controversy (Bastian, 2020, Taleb, 2020) but what it did is highlight the difficulties of being objective and human. At this moment in time it is extremely difficult not to be influenced by the problems of base-rate neglect, loss aversion, and availability bias via the media as we count the daily international infection/death figures (Gaurav, 2020). In this post I want to concentrate on how important it is to understand the significance of accurate base-rate (prevalence) reporting  so we can allocate the correct amount of training and resources to the dental profession based of the potential aerosol risk in virus transmission. In a paper by Chambers on base-rates in dental decision-making there is a quote (Chambers, 1999):

‘Base your decisions on either the baseline alone or the evidence alone, depending on which one contains the most information.’

What we are seeing now is a rapid accumulation of both base-line data and evidence,  but policy decisions about the future are being based on data and precautionary principles that were only valid at the start of this pandemic. To highlight this, I would like to explore how we are going to test the real-world effectiveness of the personal protective equipment (PPE) and cross infection protocols that are flooding the profession now.

Methods

I am going to look at three areas here, base-rates (prevalence), numbers of asymptomatic individuals, and power calculations regarding PPE use. For clarity I will use natural frequencies wherever possible.

Firstly, on the 14th May the Office of National Statistics (ONS) in the UK published the results of its coronavirus (Covid-19) infection survey (ONS, 2020). This data was based on 10,705 participants’ swab tests taken over a two-week period from 27th April to 10th May, the sample was drawn from households in which someone has already participated in an ONS survey to ensure the sample was representative of the wider population. From this sample 33 individuals in 30 households tested positive for COVID-19. This equates according to the ONS to 0.27% (95% confidence interval: 0.17% to 0.41%) of the population of England.

Secondly, one of the key problems with Covid-19 is asymptomatic spread (Bai et al., 2020) but there is no reliable data so any calculations here need to be looked on as a Fermi (back of an envelope) problem. To get a best estimate on the proportion of asymptomatic patients I conducted a meta-analysis of the data presented on the Oxford Covid-19 Evidence Service (Heneghan et al., 2020). The meta-analysis was carries out in R using a random effects model (See Figure 1.)

Figure 1. Forest plot of asymptomatic individuals

Asympto

There are two points of note from this forest plot, the summary estimate for asymptomatic individuals is 27% (95% CI: 12 to 45%) and the heterogeneity between studies (variability) is extremely high.

The next stage is to put the base-rate and number of asymptomatics together in the form of a frequency tree. For ease of calculation I have rounded the figures so a base-rate of 0.27% becomes 1 in 400,  and the number of asymptomatics becomes 30% (See Figure 2.).

Figure 2. Frequency tree of asymptomatic vs symptomatic

Asympto_1

The frequency tree illustrates that in this population 1 out of every 1333 people could be an asymptomatic carrier of Covid-19.

How does this relate to dentistry? On the precautionary principle we are operating under at the moment the presumption is that all (100%) the patients are asymptomatic carriers rather than the true figure of 0.075% ( I have assumed symptomatic patients will not be attending a dental surgery or will be triaged out prior to entering the clinical environment). This becomes important when we want to test if our PPE and protocols are effectively protecting both the patients and the staff.  We now need to set up a study comparing PPE that is adequately powered to eliminate the effects of random chance around such a small prevalence statistic (Button et al., 2013). I have created three examples of PPE for aerosol generating procedures:

  • Perfect PPE model (fluid resistant disposable gowns, FFP3 masks, visors, ventilation, long fallow periods etc) with a 99%  chance of reducing viral contamination
  • Realistic expectations of enhanced PPE practice (FFP2, reusable surgical gown, rubber dam etc) at 93%.
  • Standard practice (surgical masks etc) at 80%.

I placed the data into an apriori sample size calculator (G*Power 3.19.2) with a error probability is 0.05 and power (1-b error probability) of 0.8 (See Table 1).

Table 1. Sample sizes for a well powered study into PPE effectiveness

asympto_tableAs we can see even in a simulation study, we are going to have to at least place over a hundred individuals in each arm of the study. To see if the benefit translates into the real-world, we need to go up two orders of magnitude to see if there is a significant difference between perfect and good PPE  based on accurate population base-rate figures.

Discussion

The purpose of this opinion paper was to highlight the potential problems that a precautionary principle can create in healthcare when we work on the assumption that 100% of the patients attending a dental surgery are infectious. Guidelines and protocols need to take into consideration the absolute risk within the population based on data that is accurate and up to date. Simulation studies, and pilot studies rarely carry their full reported success into the real world (Kistin and Silverstein, 2015). Without taking a deep breath and objectively assessing the changing data regarding Covid-19, policy makers, academics, and clinicians can unconsciously fall fowl of the base-rate fallacy and availability biases created by the modern media. High quality PPE and staff training is a vital component of keeping everyone safe from this virus but we must be mindful of the other effects that perfect practice can have on the health economics and affordability of health care to those most vulnerable.

Disclaimer:  The article has not been peer-reviewed; it should not replace individual clinical judgement, and the sources cited should be checked. The views expressed in this commentary represent the views of the author and not necessarily those of the host institution. The views are not a substitute for professional advice.

References

BAI, Y., YAO, L., WEI, T., TIAN, F., JIN, D. Y., CHEN, L. & WANG, M. 2020. Presumed Asymptomatic Carrier Transmission of COVID-19. JAMA.

BASTIAN, H. 2020. A rebuttal to “A fiasco in the making?” [Online]. Available: http://hildabastian.net/index.php/8-secondary/87-a-rebuttal-to-a-fiasco-in-the-making [Accessed].

BUTTON, K. S., IOANNIDIS, J. P., MOKRYSZ, C., NOSEK, B. A., FLINT, J., ROBINSON, E. S. & MUNAFÒ, M. R. 2013. Power failure: why small sample size undermines the reliability of neuroscience. Nature Reviews Neuroscience, 14, 365-376.

CHAMBERS, D. W. 1999. The roles of evidence and the baseline in dental decision making. J Am Coll Dent, 66, 60-7.

GAURAV, S. 2020. Behavioural Economics in the Fight Against COVID-19: BOMA Framework.

HENEGHAN, C., BRASSEY, C. & JEFFERSON, T. 2020. COVID-19: What proportion are asymptomatic? [Online]. Available: https://www.cebm.net/covid-19/covid-19-what-proportion-are-asymptomatic/ [Accessed].

IOANNIDIS, J. P. 2020. A fiasco in the making? As the coronavirus pandemic takes hold, we are making decisions without reliable data [Online]. STAT. Available: https://www.statnews.com/2020/03/17/a-fiasco-in-the-making-as-the-coronavirus-pandemic-takes-hold-we-are-making-decisions-without-reliable-data/ [Accessed].

KISTIN, C. & SILVERSTEIN, M. 2015. Pilot studies: a critical but potentially misused component of interventional research. Jama, 314, 1561-1562.

ONS. 2020. Coronavirus (COVID-19) Infection Survey pilot: England, 14 May 2020 [Online]. Available: https://www.ons.gov.uk/peoplepopulationandcommunity/healthandsocialcare/conditionsanddiseases/bulletins/coronaviruscovid19infectionsurveypilot/england14may2020 [Accessed].

TALEB, N. 2020. EVIDENCE BASED is often BS [Online]. Available: https://twitter.com/nntaleb/status/1240641133820207104 [Accessed].


Which occupations have the highest potential exposure to the coronavirus (COVID-19)?

The Office for National Statistics (ONS) has created an estimate of exposure to generic disease, and physical proximity to others, for UK occupations based on US analysis of these factors (ONS, 2020).

Dental-Hygienist

Link to The Dental Elf

Background

The ONS  produced a bubble plot on the 11th May to illustrate in their own words the:

‘clear correlation between exposure to disease, and physical proximity to others across all occupations. Healthcare workers such as nurses and dental practitioners unsurprisingly both involve being exposed to disease on a daily basis, and they require close contact with others, though during the pandemic they are more likely to be using PPE.’

From the plot it is clear to see that dentistry (dentist and dental nurse) are in the extreme top right corner denoting the highest exposure to disease and closes proximity to other people in the workplace, not only patients but also staff (See Figure 1).

Figure 1.  ONS Exposure to disease vs proximity to others

Bubble_v1

It is extremely easy to misinterpret this chart and I would argue this could be a classic case of  ‘correlation does not imply causation’.  Though technically we are as a profession, very close to our patients faces this does not imply that we, or the patients are at higher risk of catching a disease. Since the emergence of Human Immunodeficiency Virus (HIV) in the early 1980’s the dental profession has been fully aware of the risk that blood bourne (HepB+C), and respiratory infections (TB, SARS, MERS, H1N1) pose to both the patients, staff and population in general. The use of high levels of personal protective equipment (PPE), and staff who are specially trained in decontamination and cross infection measures has been normalised in the dental profession for over forty years.

Methods

To illustrate this, I thought it might be interesting to see how the dental profession compared to similar professional groups using the ONS’s ‘Occupations and exposure to disease’ and  ‘All death occurrences at ages 16 to 74 in England and Wales between 2001 and 2010’ data sets. From the 299 diagnostic codes for mortality I selected the 24 codes that represented respiratory disease excluding cancer (See Annex A). From this data five additional groups were selected where the demographics and data were comparable to dentist’s socio-economically, the 10 years mortality rate and relative risk were calculated based on weighted means.

Results

There were six professional groups were dentists, doctors, pharmacists, solicitors, higher education teaching professionals, and accountants/financial managers. Broadly speaking even though the dentists are physically closest to the patient, and potentially at the greatest risk of exposure they had 3.5 times  less respiratory disease than their non-healthcare peers. Doctors were just slightly lower risk than the dentist (See Figure 1., Table 1.)

Figure 1. Respiratory disease vs profession

respvsprof

Table 1. Occupation data.

Occupation title Dentists Doctors Pharmacists Solicitors Higher education Accountants
Proximity to others(ONS units?) 97.0 89.2 72.0 34.0 50.7 45.75
Exposure to disease(ONS units?) 90.0 91.2 76.0 14.0 11.1 3.4
Total in employment 41,000 296,000 70,000 122,000 178,000 361000
Percentage female 52.6 48.9 67.6 56 46.4 44.8
Percentage aged 55+ 11.8 16.5 14.9 18.9 25.8 16.9
Percentage BAME 28.2 27.9 32.4 14.4 9.9 11.3
Respiratory disease male age 16 to 64(excl. cancer) 6 33 10 59 95 169
Respiratory disease female age 16 to 64 (excl. cancer) 1 8 8 12 17 46
Respiratory disease total age 16 to 64 (excl. cancer) 7 41 18 71 112 215
Mortality rate (MR)x10^-4 1.71 1.39 2.57 5.82 6.29 5.96
Relative risk (RR) 1.00 0.81 1.51 3.41 3.69 3.49

 Discussion

From the data presented in this opinion piece we can clearly see that the dental profession works in an environment that poses a high risk of exposure to respiratory disease. We can also see that as a profession we suffer less respiratory disease than our peers, especially those not working in the healthcare sector, and I would propose this is due to the high degree of training regarding cross-infection and careful use of PPE. It is important however to remember that this data was collected between 2001 and 2010 so it does not represent the current situation regarding Covid-19.

Disclaimer:  The article has not been peer-reviewed; it should not replace individual clinical judgement, and the sources cited should be checked. The views expressed in this commentary represent the views of the author and not necessarily those of the host institution. The views are not a substitute for professional advice.

References

ONS. 2020. Which occupations have the highest potential exposure to the coronavirus (COVID-19)?[Online].Available: https://www.ons.gov.uk/employmentandlabourmarket/peopleinwork/employmentandemployeetypes/articles/whichoccupationshavethehighestpotentialexposuretothecoronaviruscovid19/2020-05-11 [Accessed].

Appendix

Appendix A. Respiratory diseases(excluding cancer)

Respiratory Disease
Influenza
Tuberculosis
Viral pneumonia
Pneumococcal pneumonia
Other bacterial pneumonia
Other specified pneumonia
Bronchopneumonia
Unspecified lobar pneumonia
Unspecified pneumonia
Acute bronchitis/bronchiolitis
Chronic bronchitis and emphysema
Asthma
Bronchiectasis
Coal worker’s pneumoconiosis
Asbestosis
Silicosis
Other and unspecified pneumoconiosis
Pneumoconiosis with tuberculosis
Byssinosis
Airways disease due to other specific organic dust
Farmer’s lung disease
Bird fancier’s lung
Other and unspecified allergic pneumonitis
Respiratory conditions from chemical fumes
Pulmonary fibrosis